Intent Verification Rules
This tech note describes the association between the intent verification rules and the technology tables and how to read those associations through the API.
The results of the intent verification checks are identified as "reports" in the API and are essentially a series of rules by which columns in the technology tables are coloured.
Instructions
In order to handle the intent verification checks to be able to act on them then, there are a series of steps.:
First step is to fetch a list of the reports from the snapshot you're interested in. This is a simple GET request to /api/{api_version}/reports?snapshot=<id> where <id> is $last or a valid snapshot id. The JSON dictionary returned is a list of reports created in the snapshot, with information about:
- the table they relate to
- the columns coloured by the test
- the conditions for each color
- the values used to mark the columns
Example
Example of DMVPN status report
    {
        "groups": [
            {
                "id": "318508186",
                "custom": false,
                "name": "Stability"
            }
        ],
        "apiEndpoint": "/v1/tables/security/dmvpn",
        "checks": {
            "0": {
                "and": [
                    {
                        "state": [
                            "eq",
                            "UP"
                        ]
                    }
                ]
            }
        },
        "column": "state",
        "custom": false,
        "defaultColor": 20,
        "descriptions": {
            "checks": {
                "0": "DMVPN tunnels that are in the 'UP' state.",
                "10": "",
                "20": "DMVPN tunnels that are in other than the 'UP' state.",
                "30": ""
            },
            "general": "Verifies the operational state of Dynamic Multipoint VPN (DMVPN) tunnels.\n"
        },
        "name": "DMVPN Tunnel State",
        "webEndpoint": "/technology/security/dmvpn",
        "id": "322178616",
        "status": -1,
        "result": {}
    }
Breaking this down, we can see that the report
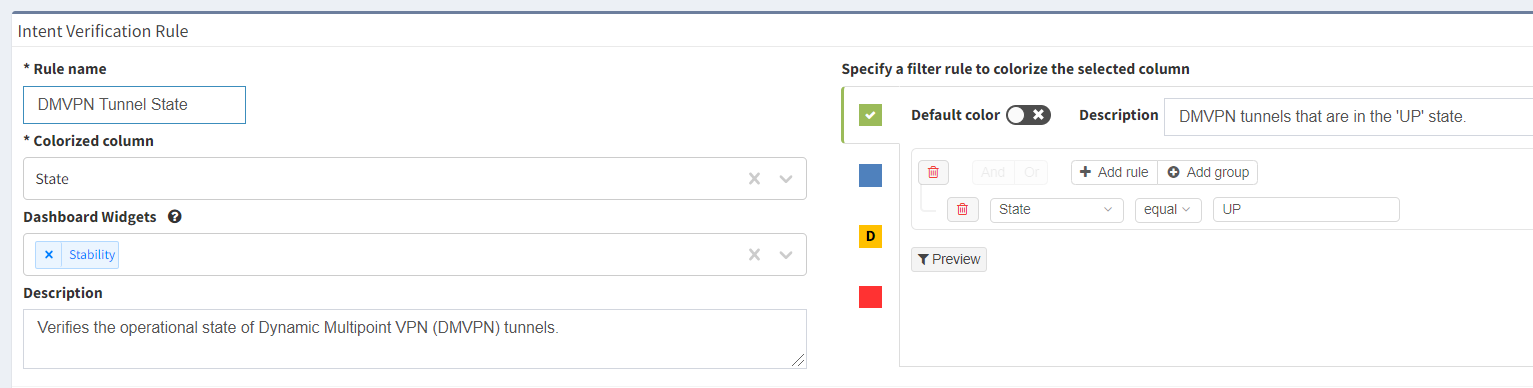
- is called "DMVPN Tunnel State"
- is presented in the "Stability" group on the dashboard
- relates to the technology table accessed through the API endpoint
/api/{api_version}/tables/security/dmvpnor the web UI endpoint/technology/security/dmvpn - sets the color of the "state" column in that table
- sets the color to a value of 0 (which maps to green) if the tunnels are in the
UPstate, signified by the content of the "state" column having the valueUP, otherwise resorting the default of 20 (which maps to amber) if the tunnels are in any other state.
We can compare that with the Web UI dialogue for the same check:
So once we have found the report we are looking for, we retrieve the technology table from the apiEndpoint field in the report dictionary, filtered for the colour that matches the condition we’re interested in from the validation check. From our above example then, to retrieve the DMVPN tunnels that are in an UP state, we make a POST request to /api/{api_version}/tables/security/dmvpn with the following request payload:
{
  "columns": [
    "id",
    "sn",
    "hostname",
    "siteKey",
    "siteName",
    "peerNbma",
    "peerTunnel",
    "state",
    "time",
    "attrb"
  ],
  "filters": { "state": ["color", "eq", "0"] },
  "snapshot": "$last",
  "reports": "/technology/security/dmvpn"
}
This will retrieve a dictionary with the data from the columns listed in the technology table from the last snapshot, filtered on the value of the state column equalling 0 -- which equates to the colour green from the validation check.
Note that snapshot management is referred to in a separate article - the $last snapshot may not be the best to query on in all cases.