Addressing
The Addressing section provides information about every IP address on every managed network infrastructure device.
IP addresses should be unique throughout the network, except for highly specialized applications like geographical service distribution via anycast. Duplicate IPs usually signify a network fault, such as loss of a keep alive link or misconfiguration, and actively managed duplicate IP addresses are listed in a separate table.
Verifying The Network
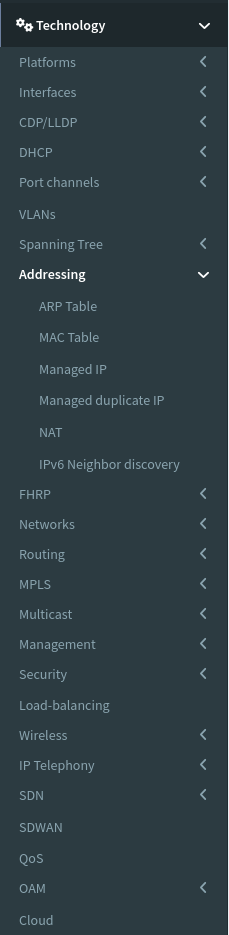
You can verify a lot of technologies and configuration parts with IP Fabric. You can simply go through technologies in IP Fabric menu (for example MAC table):
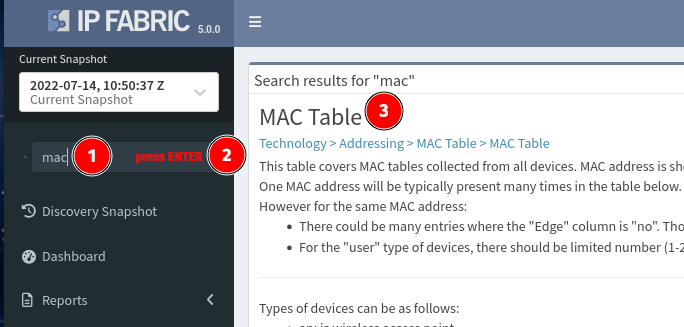
or quickly find particular technology you are interested in using search (for example MAC table):
Today's goal is to check all port channels in our network.
Step 1 – Find The Proper Technology Table
As described above we can simply browse IP Fabric menu and find a particular technology table but in our case as we know exactly what we are looking for, search menu will be a better choice.
In the upper right corner click to search field and type your request. We are looking for port channels, ether channels or just link aggregation. Because I'm from Cisco world I would type in port channel.
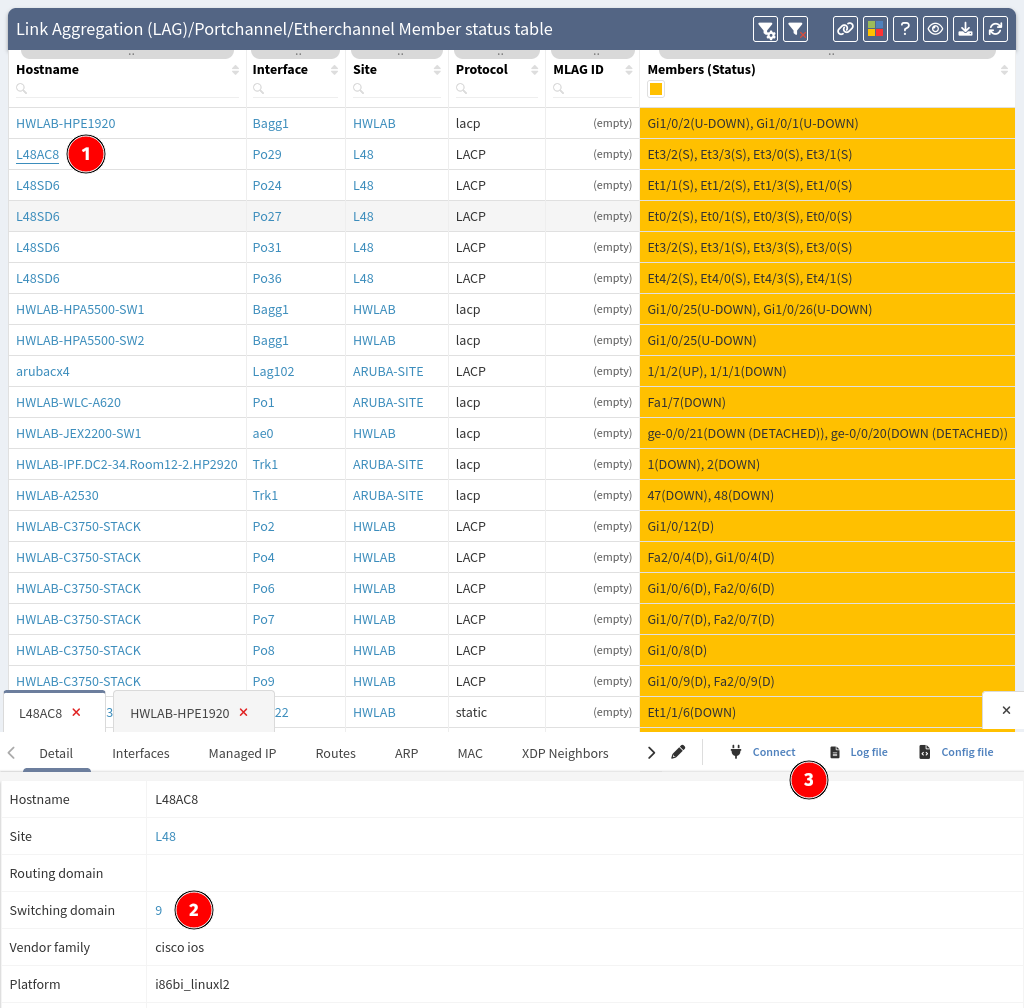
Search returns more results because there are more technology tables with port channels. We are interested in the last one in this case Link Aggregation (LAG)/Portchannel/Etherchannel Member status table. Just click on it and we are there.
Step 2 – Look For Malfunctions
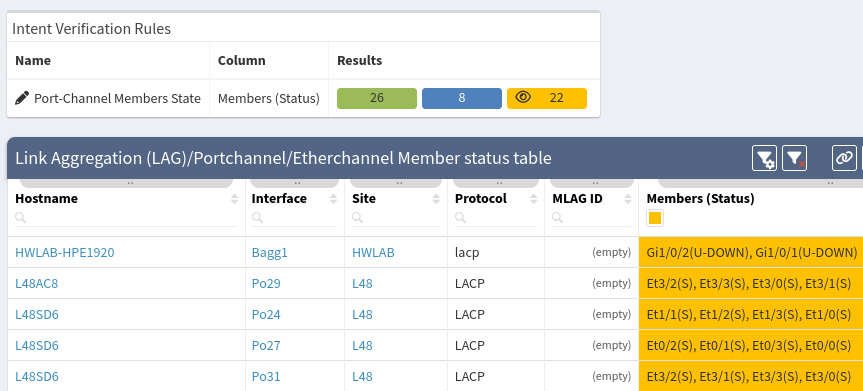
For your convenience IP Fabric has predefined a lot of rules and reports. In our particular case port channels are colored green if everything is OK and other color is used when some malfunction is in place. You can easily sort the table by clicking the desired field in the header. In the example below we clicked on Members (Status).
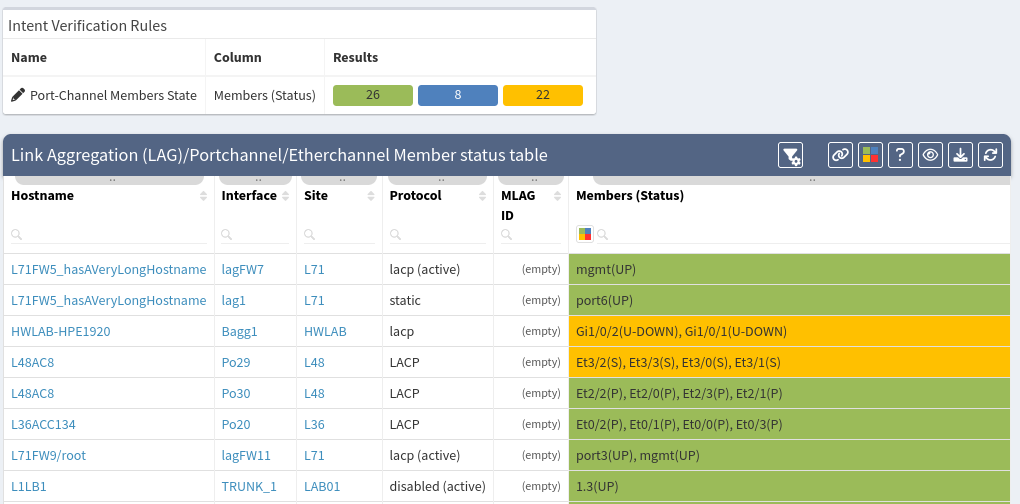
We can instantly see that some port channels have interface down (blue color) or individual port (yellow color).
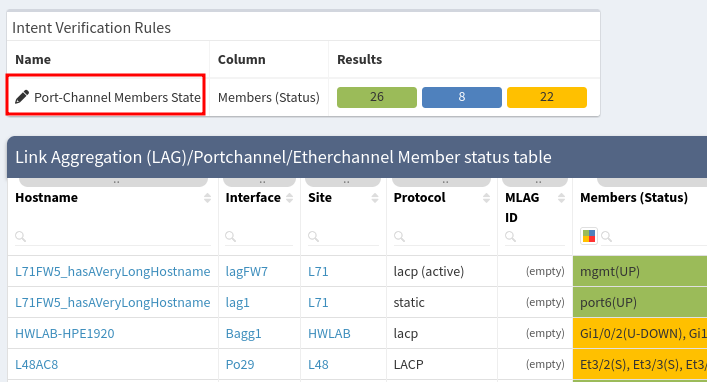
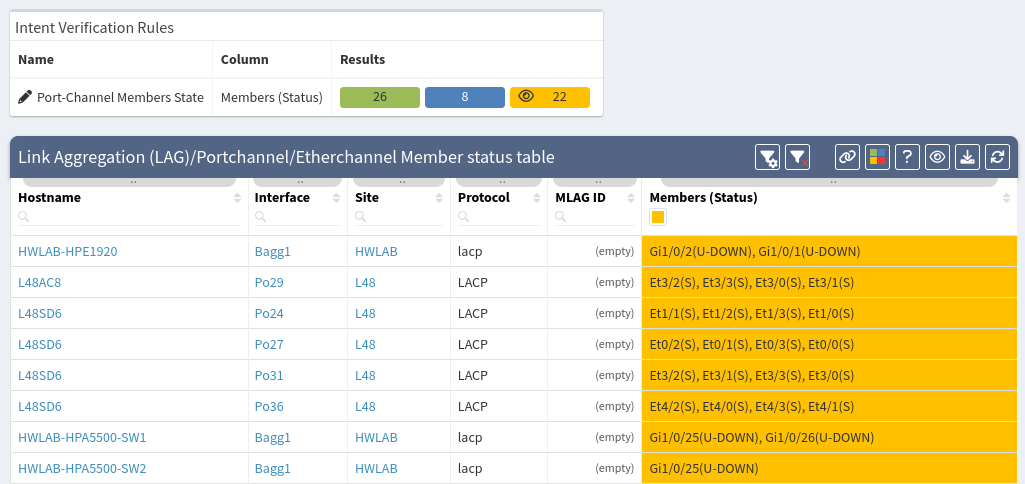
You can also filter colors by clicking them above in Reports box. When clicked small eye icon is displayed and items are filtered only to the selected color. Click again to the same color to clear filter.
Customize Predefined Rules
Predefined coloring rules can be fully customized. To do that click on predefined rule name in Reports box above the technology table which is Port-channel members state in our case.
Now you can check and change predefined colorization rules.
Let's change coloring from blue to red when port in port-channel is down:
- Remove rules from blue color. Click on blue color and then trash
icon:
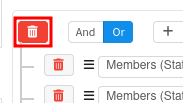
- Click to red color and Add rule.
- Select logical OR because we want mark member red if any of defined rules apply.
- We are interested in Members (Status) table row.
- We would like to check if this row contains specific string.
- Specify string we are looking for like (D) or (DOWN)
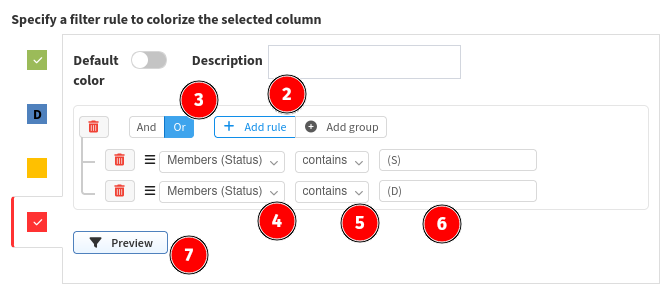
- Click Preview to see if you rule works
- If you are satisfied with the result click Update rule.
You can also add new set of coloring rules. For example, you want to check used aggregation protocol. Please check Intent Verification Rules section.
Step 3 – Fix It
In step 2 we found few malfunctioned port channels. You can gather more information in IP Fabric like check network diagrams or directly connect to device with problematic port channel.
- Click on device host name.
- You can go to network diagram (click to switching domain number).
- You can connect to device.
Step 4 – An Overall Overview
Dashboard is the right place where you can see the overall status of your network. There are predefined widgets for user convenience but you can also add, remove or edit it.
For our example with port channels you can go to Dashboard, widget Neighborship compliance and there is report called Port Channel members states. By clicking selected color you are redirected to technology table with color filter applied.
Adding Custom Report To The Dashboard
First let's create new coloring rule which will be then added to the Dashboard.
- Go to Technology → Port Channels → Member status table.
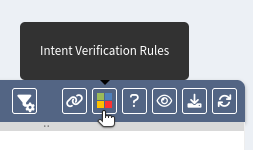
- Click to Intent Verification Rules button in the right toolbox menu.
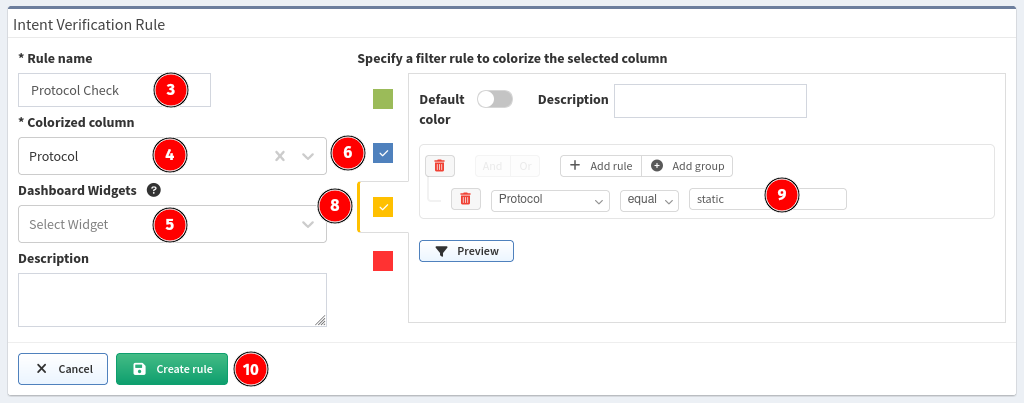
- Specify Rule name, for example Check protocol.
- Select Colorized column, it's Protocol in our case.
- Leave Widgets empty for now.
- Click on blue.
- Create rule Protocol insensitive equal
lacp - Click on yellow.
- Create rule Protocol equal static.
- Click Create rule.
We crated new coloring rule but we would like to see status of port channel protocol on the Dashboard. We can add it like this:
- Go to Dashboard.
- Click Edit in the upper right corner.
- Click +Add row.
- Choose row style what you would like to add.
- Click on Untitled and enter some name for example Port channels.
- Click +Add Widget.
- Select widget type in our case it's Intent Verifications.
- Name widget for example Port channels.
- Look for Table color rules and add it to Widget. For example Technology → Port channels → Member status table → Protocol check. We created this rule it the previous steps.
- Switch Select Widget View to percentage (default) or absolute numbers.
- Select view type (graph or summary table)
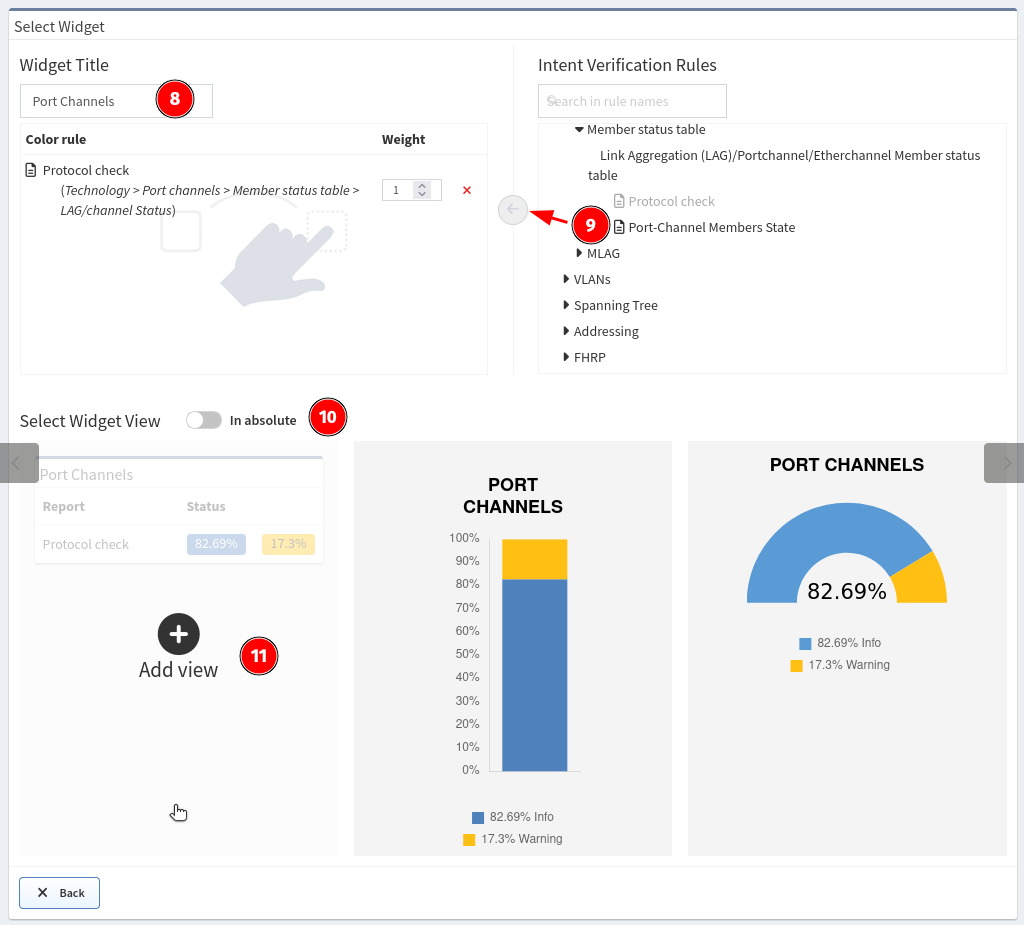
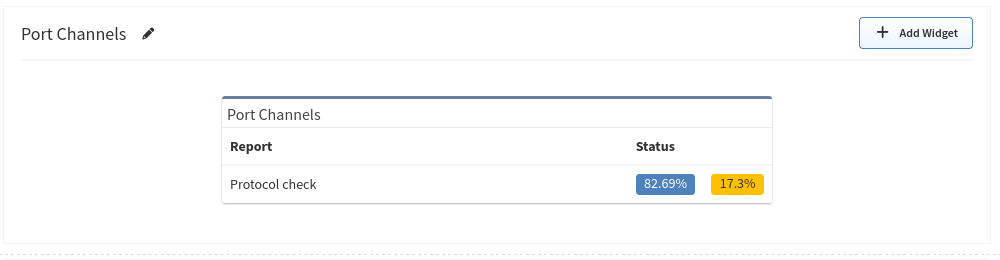
- Click Save in the upper right corner.
And here we are, our new Dashboard widget.