Navigate in Tables
Tables
Tables allow for analysis and correlation of network state information and parameters on the fly. Most of the tables display live snapshot data generated by graph algorithms without pre-existing cache. The first load of a table usually takes longer than subsequent loads, but all tables were built to handle a large capacity and complex queries, so the outcome should be better than analyzing the output in an external application like Excel.
Working With Tables
As an example, the ARP Table (in Technology → Addressing → ARP Table) is used below to demonstrate the functionality of tables.
Table Description
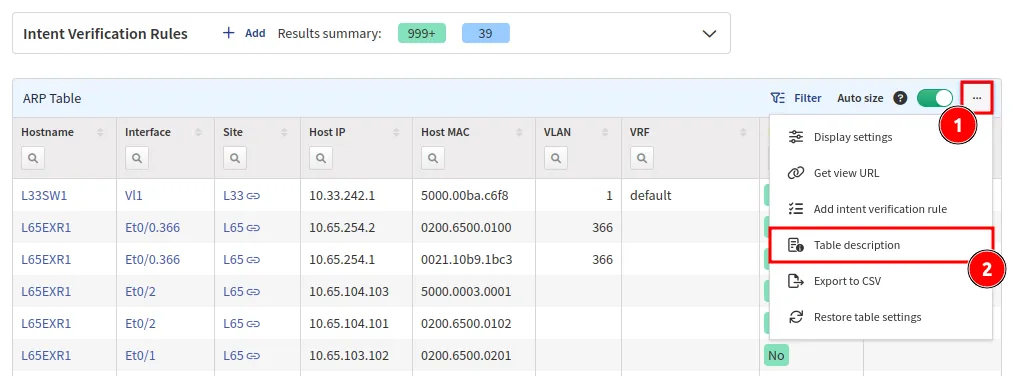
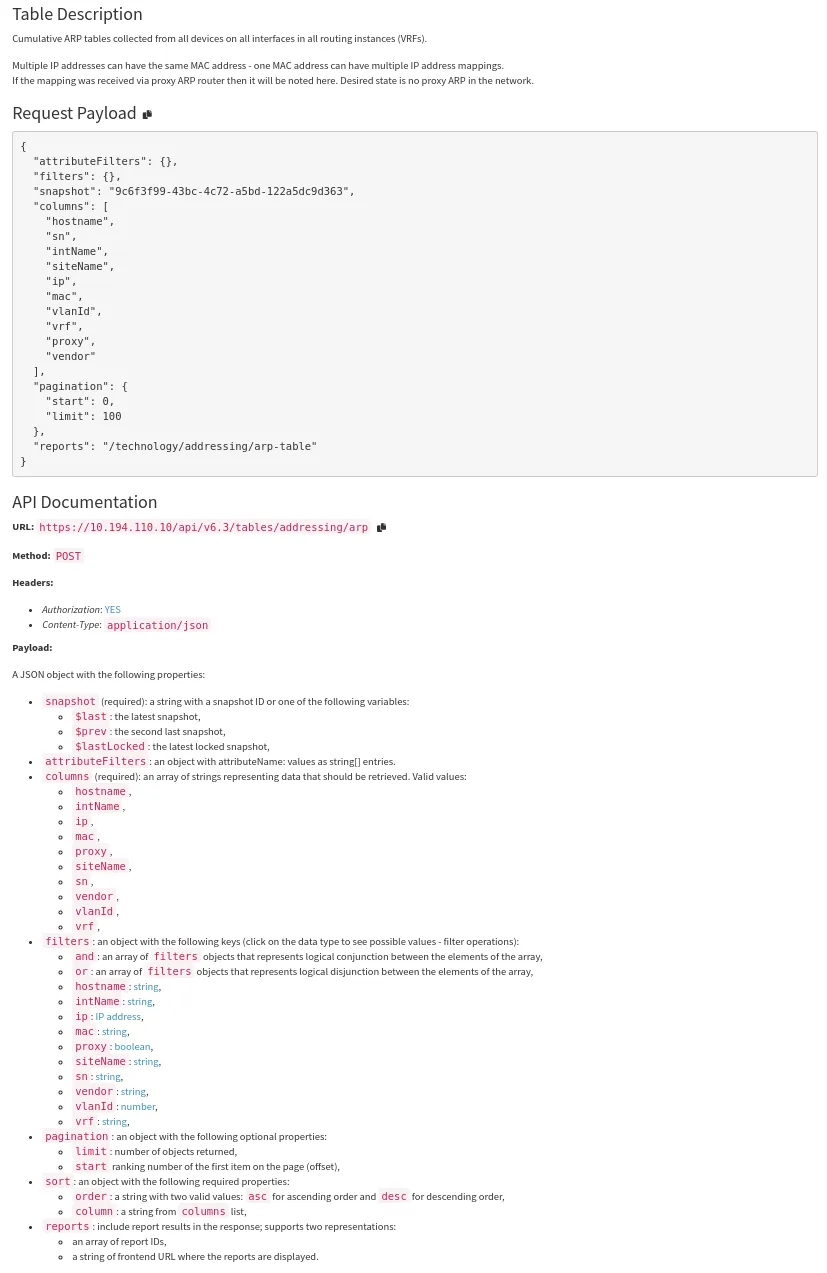
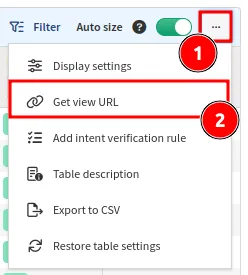
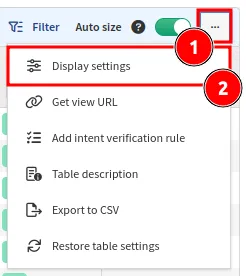
By clicking ... (the 3-dot button in the top-right corner of the table) and
selecting Table description, you can get a short description of the current
table along with API examples.
Export to CSV
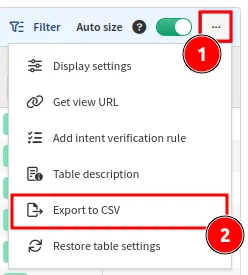
The current table view can be exported to CSV. This is useful for additional data processing in an external application.
Contextual Help
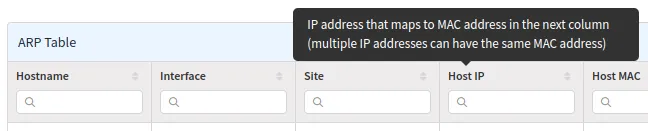
Contextual help (tooltip) is displayed when the mouse cursor hovers over a table header text or a table icon.
Searching for Data
Filters will change what is displayed in the table, the exported CSV data, and the API documentation found in the Table Description.
Simple Filtering
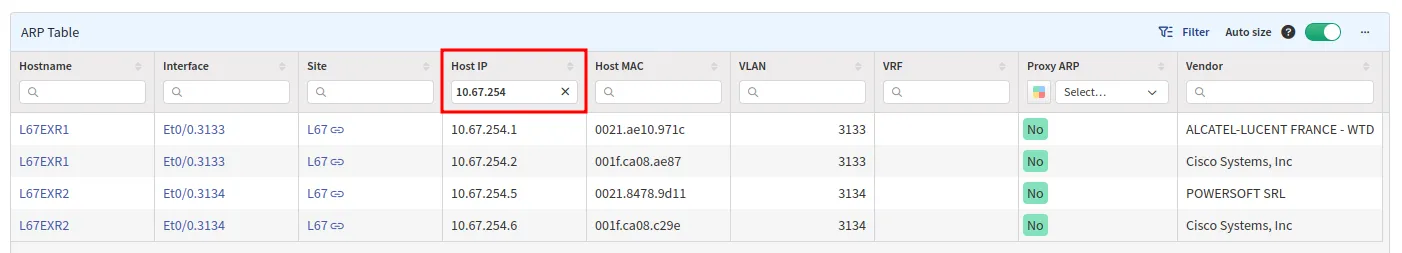
In most columns, you can type in what you are looking for. The example above
shows a search for all devices with an IP address starting with 10.67.254
throughout all the ARP tables in our lab environment.
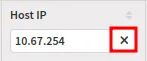
Use this button to clear the filter:
Advanced Filtering
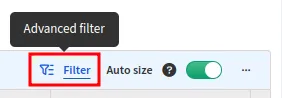
If you need a more precise filter, use Advanced Filter.
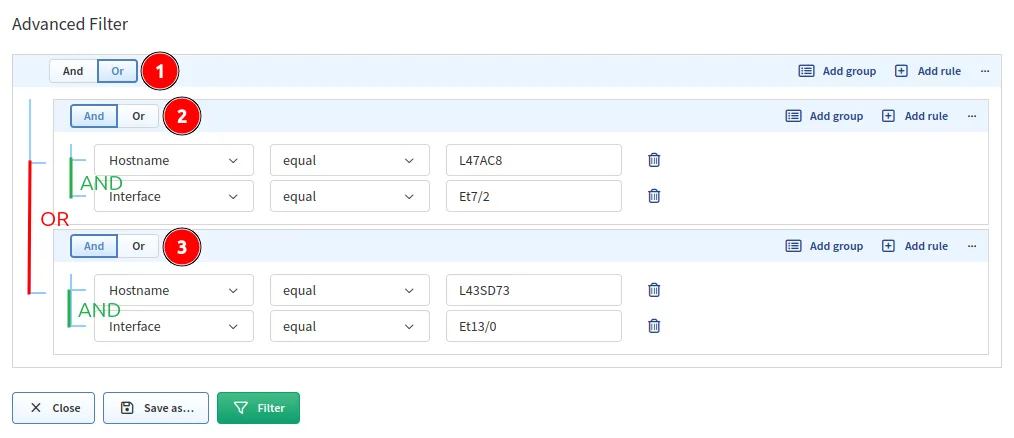
Filters are defined by groups and rules. Each group can contain one or more
rules or another group. There is always one root group which cannot be deleted
(group 1). Select the logical operator for each group. The example above shows
logical Or for group 1 and logical And for groups 2 and 3.
What does the example above do? It shows all devices with hostname L47AC8 AND
interface Et7/2 as well as devices with hostname L43SD73 AND interface
Et13/0. In other words: “Show all devices with hostname L47AC8 which have
interface Et7/2, plus all devices with hostname L43SD73 with interface
Et13/0.
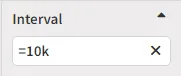
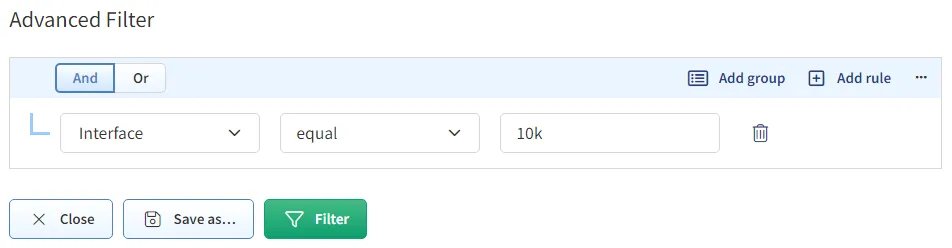
Using the Standard Metric Notation on Filtering
When filtering values in number columns using Simple Filtering or in the Advanced Filters, you can type not only numbers but also some measure prefixes (like 10k, 15M, etc.):
or
These are the available prefixes:
| Symbol | Name | Base 10 | Decimal |
|---|---|---|---|
P |
peta |
1015 | 1000000000000000 |
T |
tera |
1012 | 1000000000000 |
G |
giga |
109 | 1000000000 |
M |
mega |
106 | 1000000 |
k |
kilo |
103 | 1000 |
Share Table View
The table view can be shared with other users.
Intent Verification Rules (Colorizing Columns)
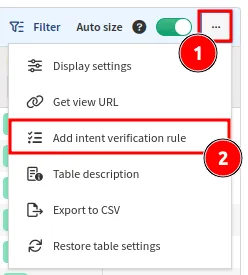
The table column can be colored based on pre-defined rules. The existing (as well as the default) rules are visible above the table and can be edited or removed.
To create a new rule, you need to specify its Rule name and select a
Colorized column. Adding the rule to a dashboard widget will enable it to be
displayed on the Dashboard, but this is optional (check the
Dashboard page for more details).
Finally, specify a filter rule to color the selected column:
- Choose a color to apply rules to.
- Add rules based on the same logic as described in Advanced Filtering.
- A color can be designated as the
Default color, meaning it will be used if no other rules are matched. - Click Update rule or Create rule to save your changes.
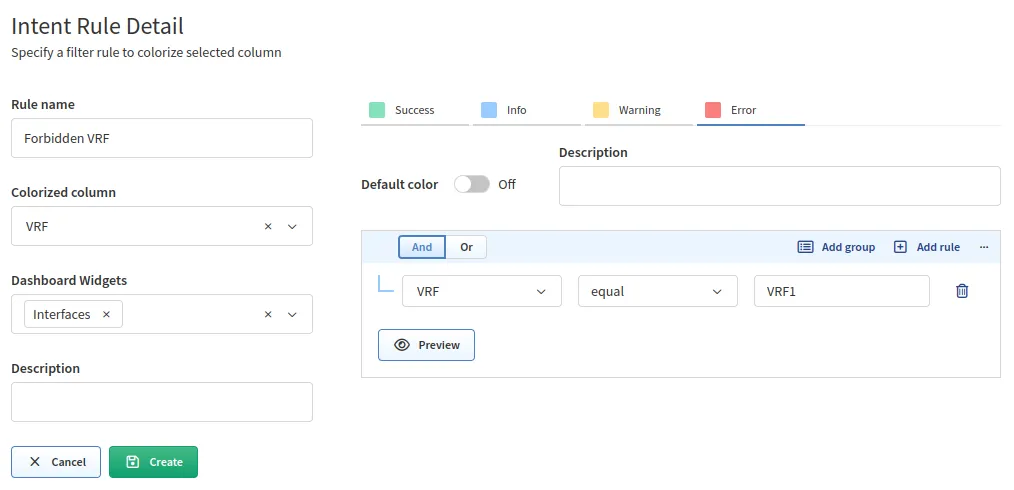
In the example above, all items in the VRF column which are named VRF1 will
be colored red. A summary number of items which match this rule will also be
displayed in the Interfaces widget on the Dashboard.
Display Settings
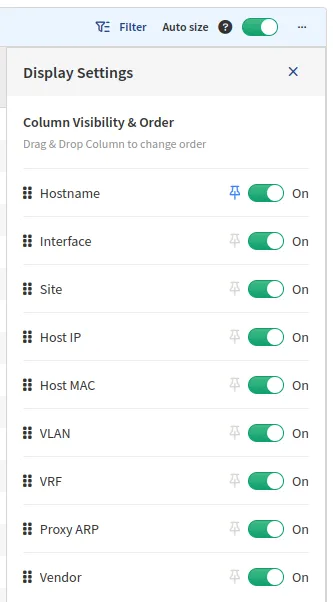
In Display Settings, you may select what columns are displayed. This will also
change the behavior of Export to CSV and the API documentation
in the Table Description.
Auto Size
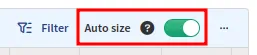
Auto size (enabled by default) ensures that columns are automatically sized to
fit their current content each time the table is opened.
By disabling Auto size, columns will remember user-defined widths.
Restore Table Settings
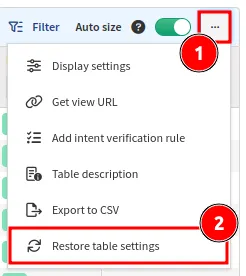
Table filters and other settings can be restored using the Restore table
settings option. Coloring rules will not be removed!