Splunk TA Overview
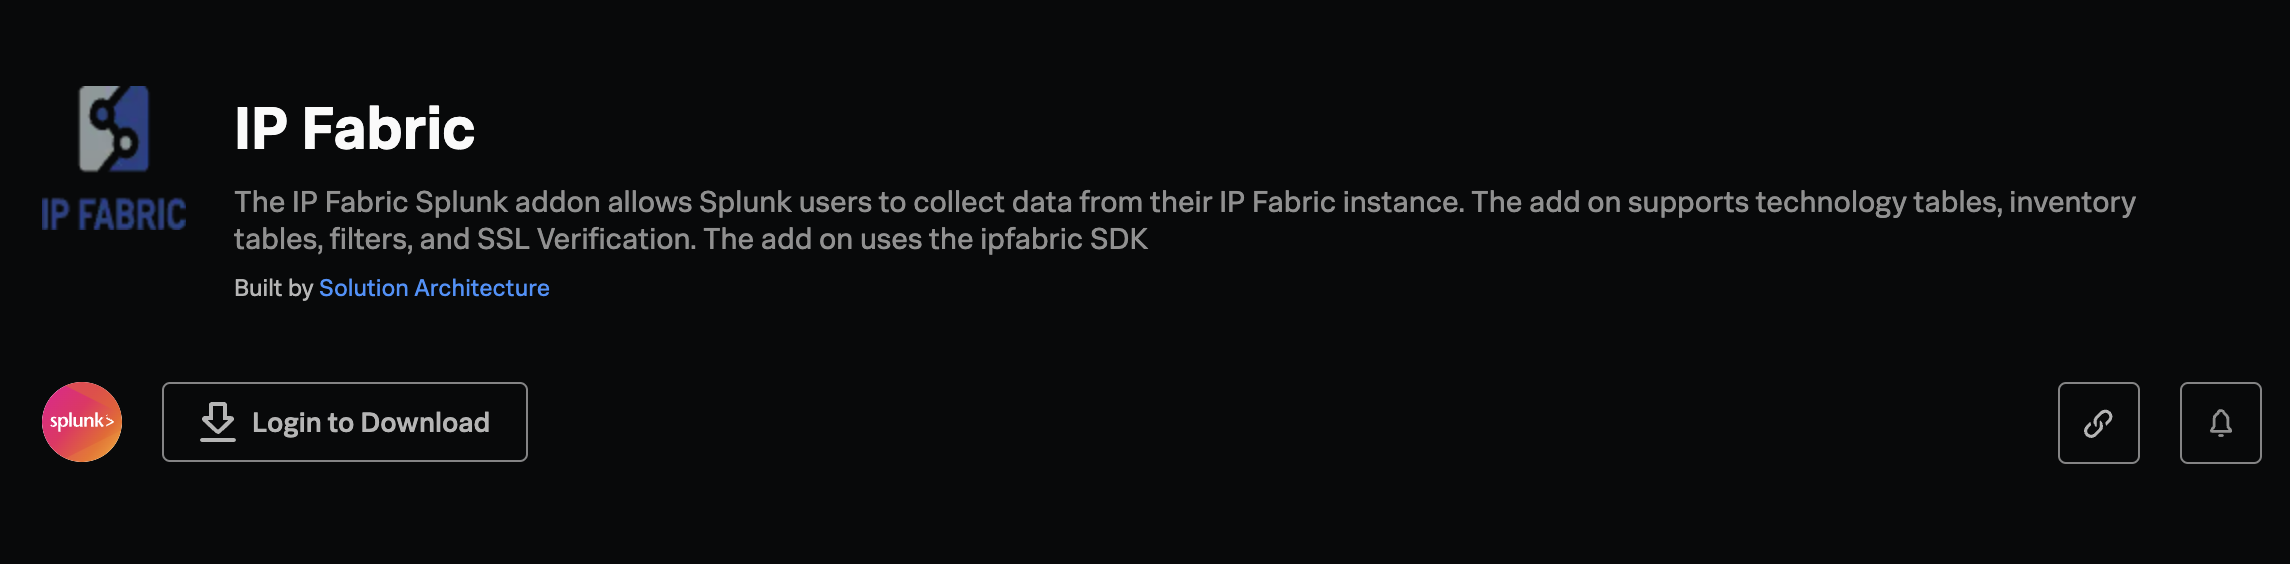
The IP Fabric Splunk TA offers a potent solution for comprehensive network monitoring and analysis. By utilizing the official IP Fabric app, you can seamlessly merge IP Fabric’s advanced network visibility capabilities with Splunk’s robust data collection and analysis functionalities. This collaboration empowers your teams to swiftly identify and troubleshoot network issues, proactively enhance security measures, and gain valuable insights from the amalgamation of IP Fabric’s network data and Splunk’s powerful analytics platform.
Installing the Add-On
Splunkbase
The IP Fabric Splunk TA is available on Splunkbase: https://splunkbase.splunk.com/app/6707/
Installing via the Splunk Web Interface
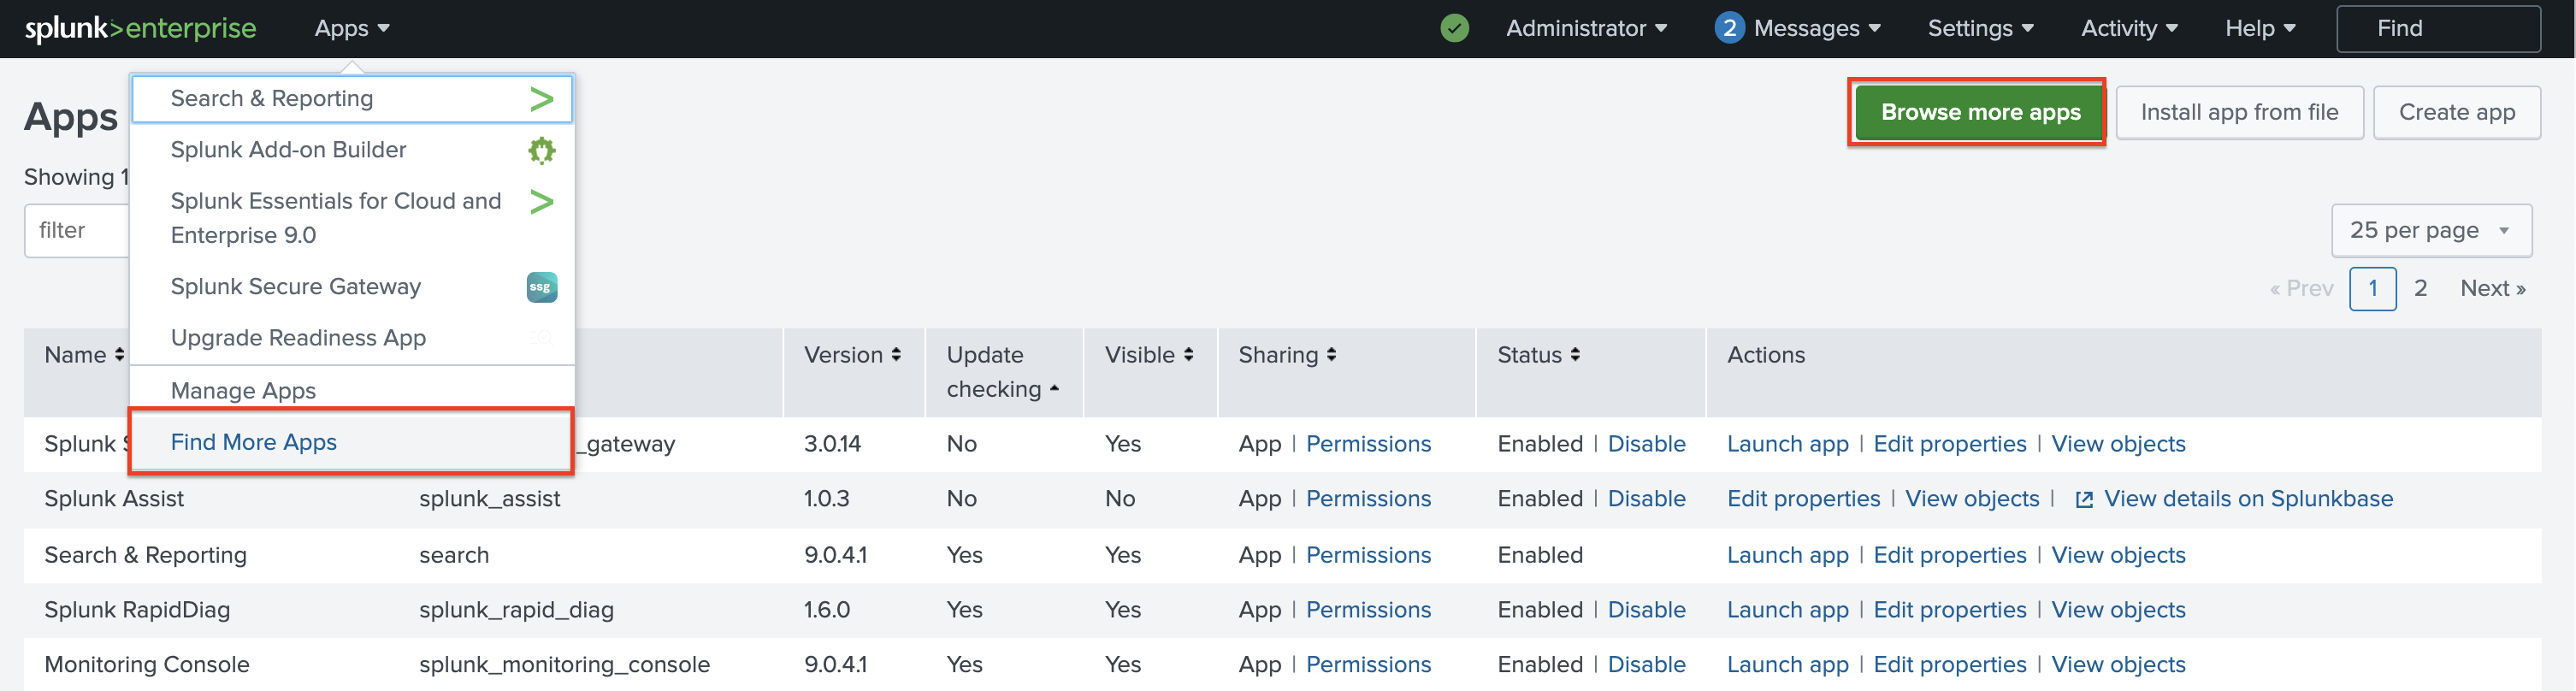
- Log in to Splunk and navigate to the Apps menu.
- Click the Browse more apps button or the Find More Apps link.
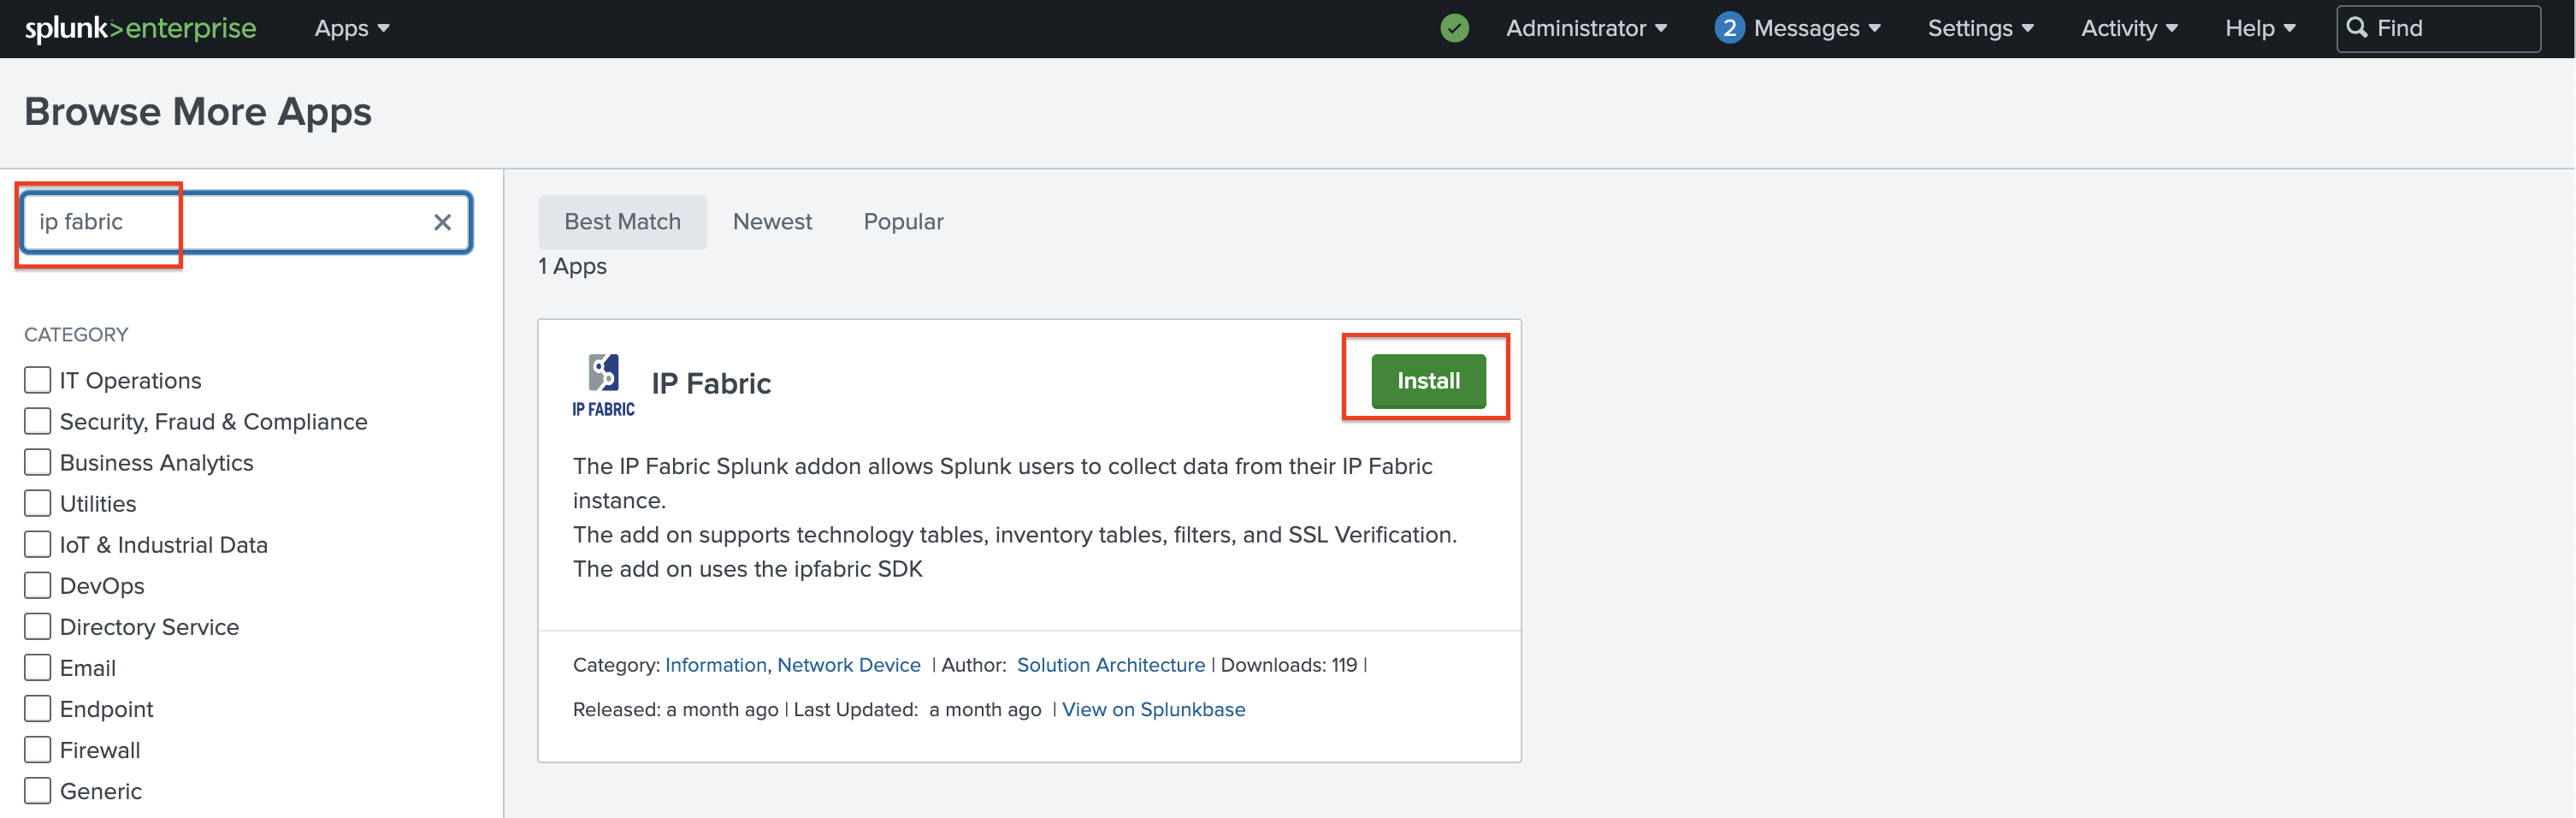
- Search for
IP Fabric. - Click Install.
Manual Installation
- Download the IP Fabric Splunk TA from https://splunkbase.splunk.com/app/6707/.
- Log in to Splunk and navigate to the Apps menu.
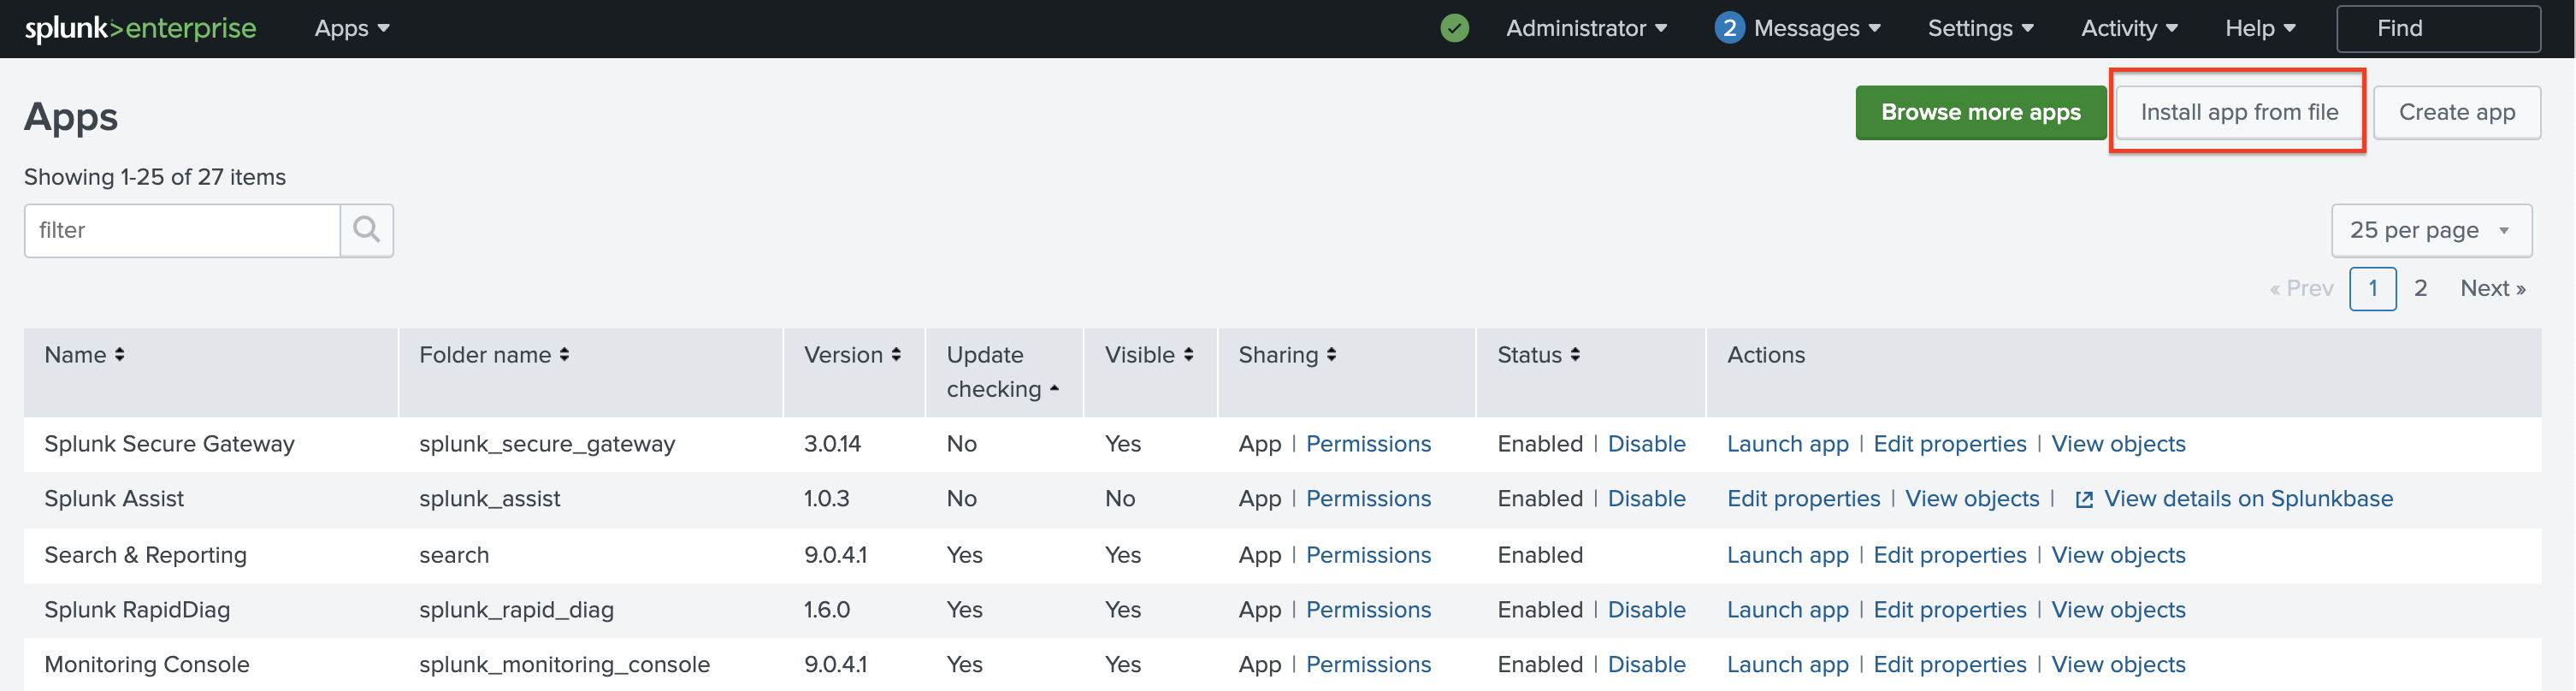
- Click Manage Apps.
- Click Install app from file.
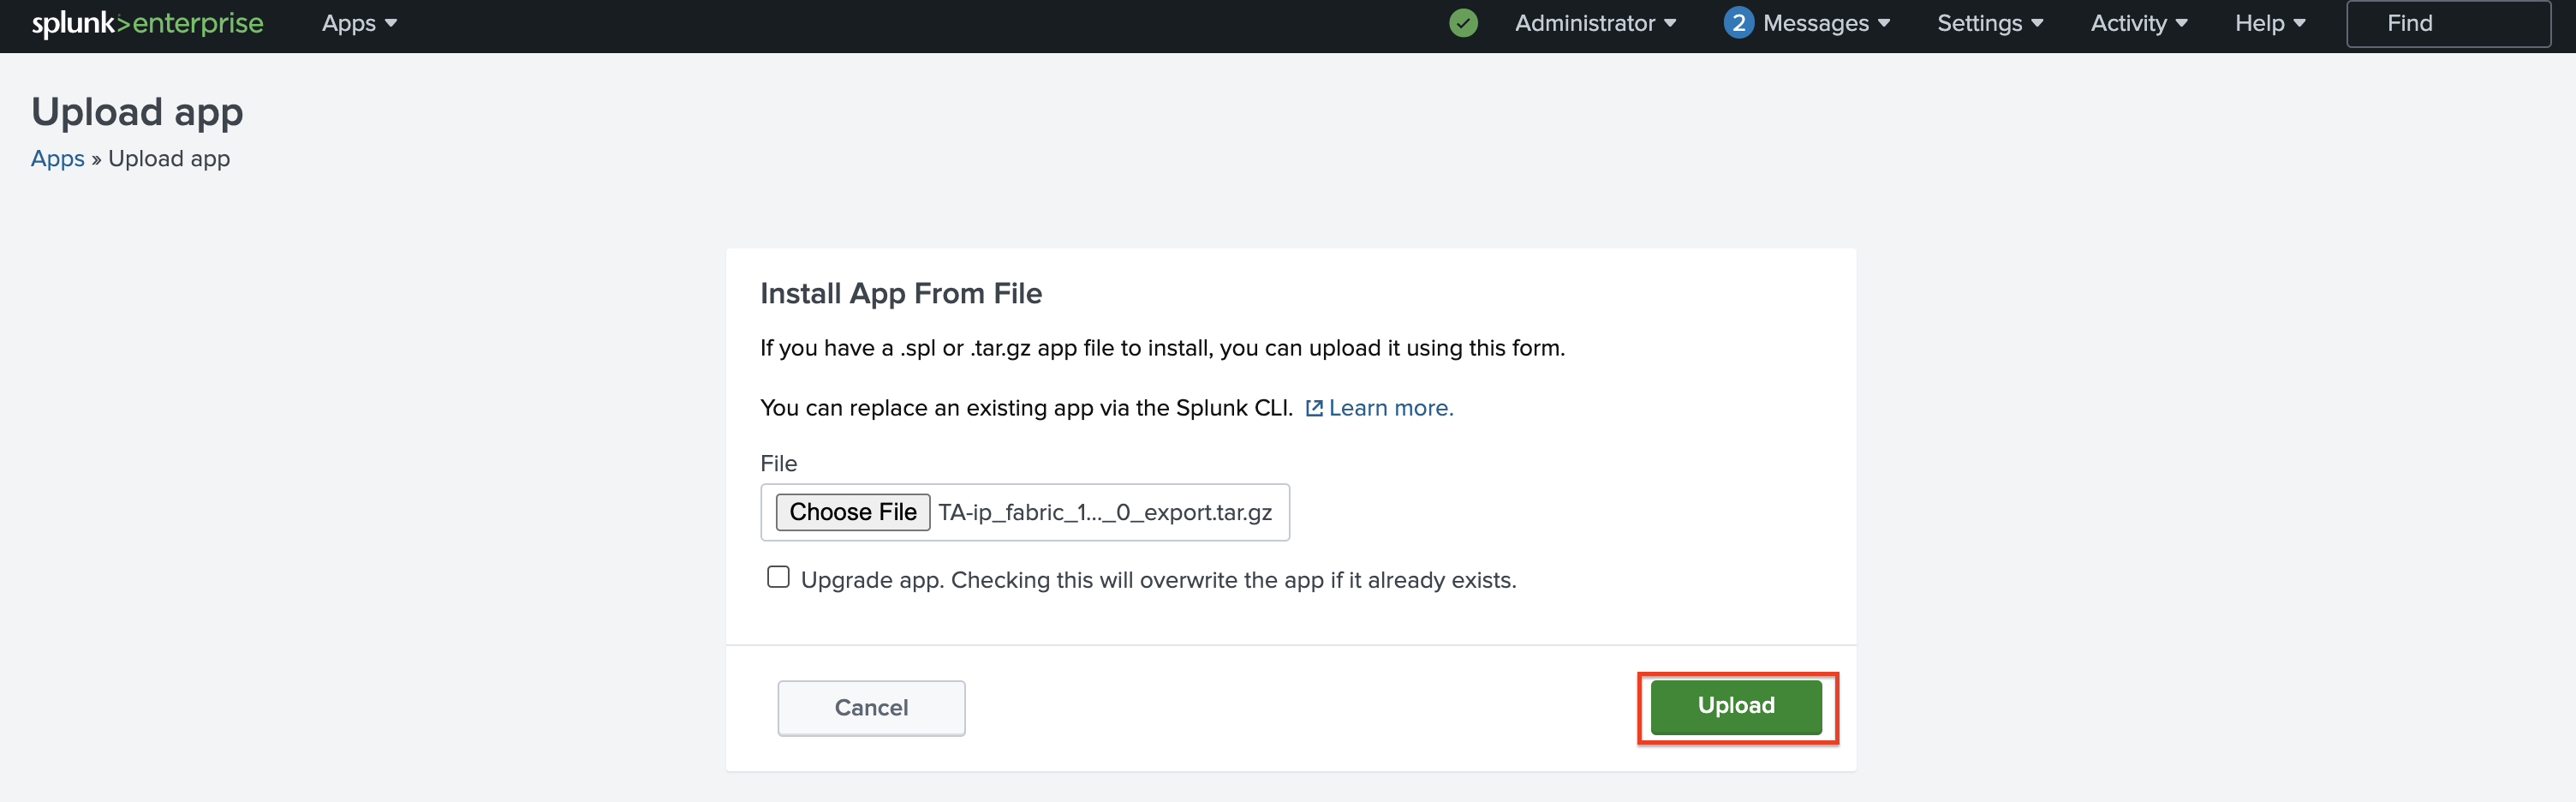
- Select the IP Fabric Splunk TA file and click Upload.
- Restart Splunk.
Configuring the Add-On
Setting Up IP Fabric API Token
- Log in to IP Fabric and navigate to Settings → Integrations → API Tokens.
- Click + Create token.
- Enter a description for the token, assign a role to it, and click Create.
- Copy the token and save it in a secure location.
- Log in to Splunk and navigate to the IP Fabric TA.
- Click the Configuration tab.
- Paste the token into the API Token field.
- Click Save.
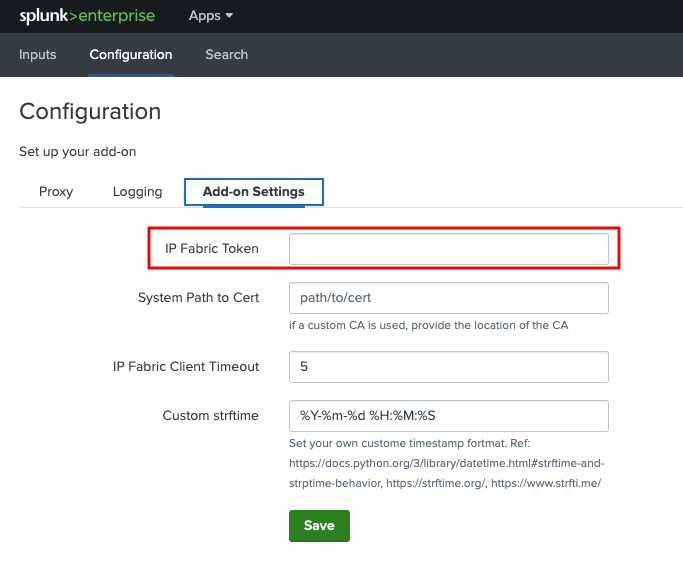
Adding a Custom strftime Format
You can customize the timestamp format by adding a custom strftime format. Please reference the Python strftime documentation for more information and how to set your own format code.
Capturing Events
- Log in to Splunk and navigate to the IP Fabric app.
- Click the Inputs tab.
- Click Create New Input.
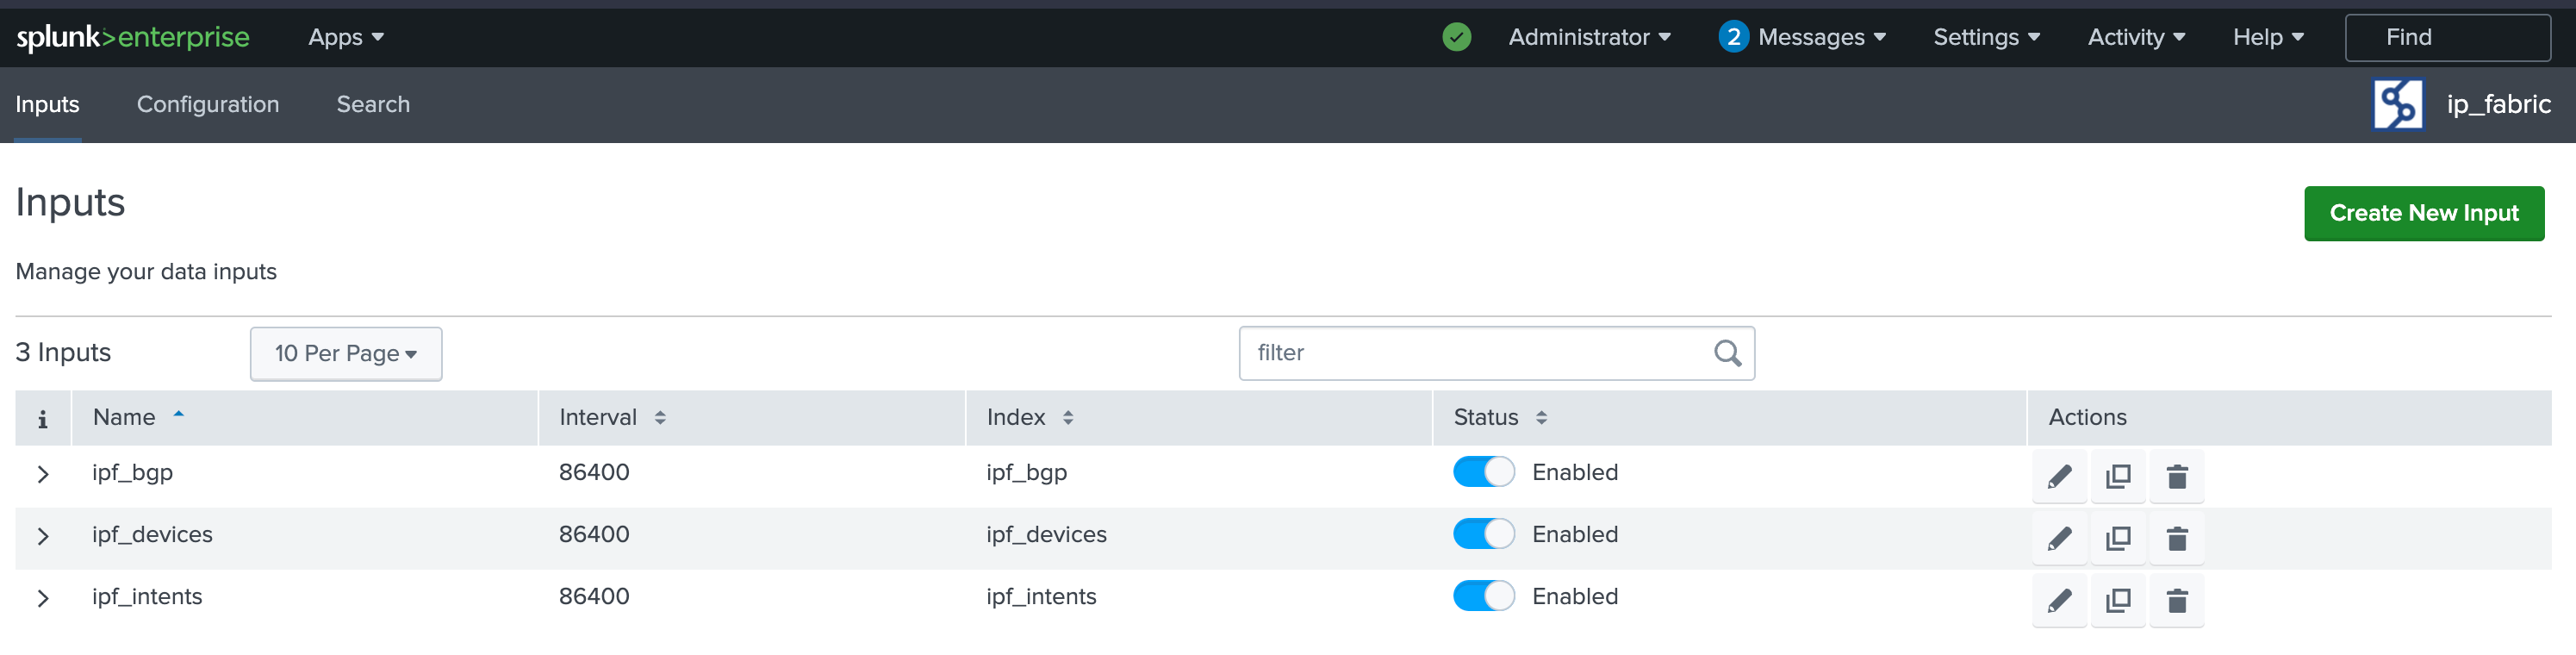
- Enter a Name for the input.
- Enter an Interval for the input.
- Enter an Index for the input.
- Enter the URL of your IP Fabric instance.
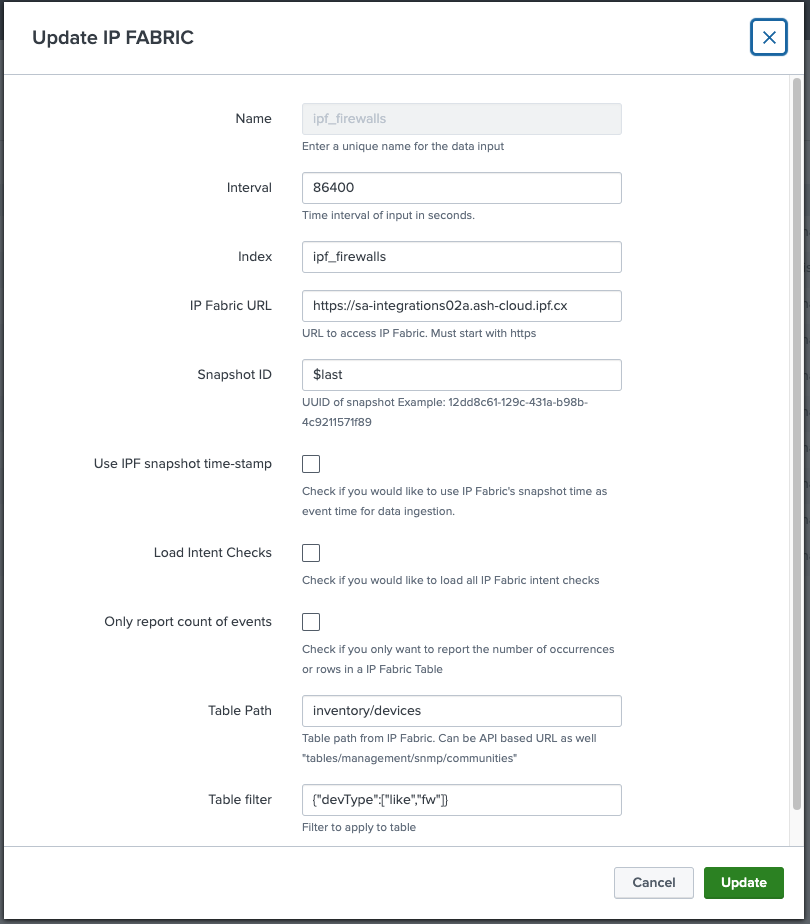
- Click Update.
Optional settings include:
- Sending the Snapshot Time with the event.
- Only capturing the amount of occurrences or rows in a specific table.
- Only capturing Intent Checks or Table Data.
Using the Add-On
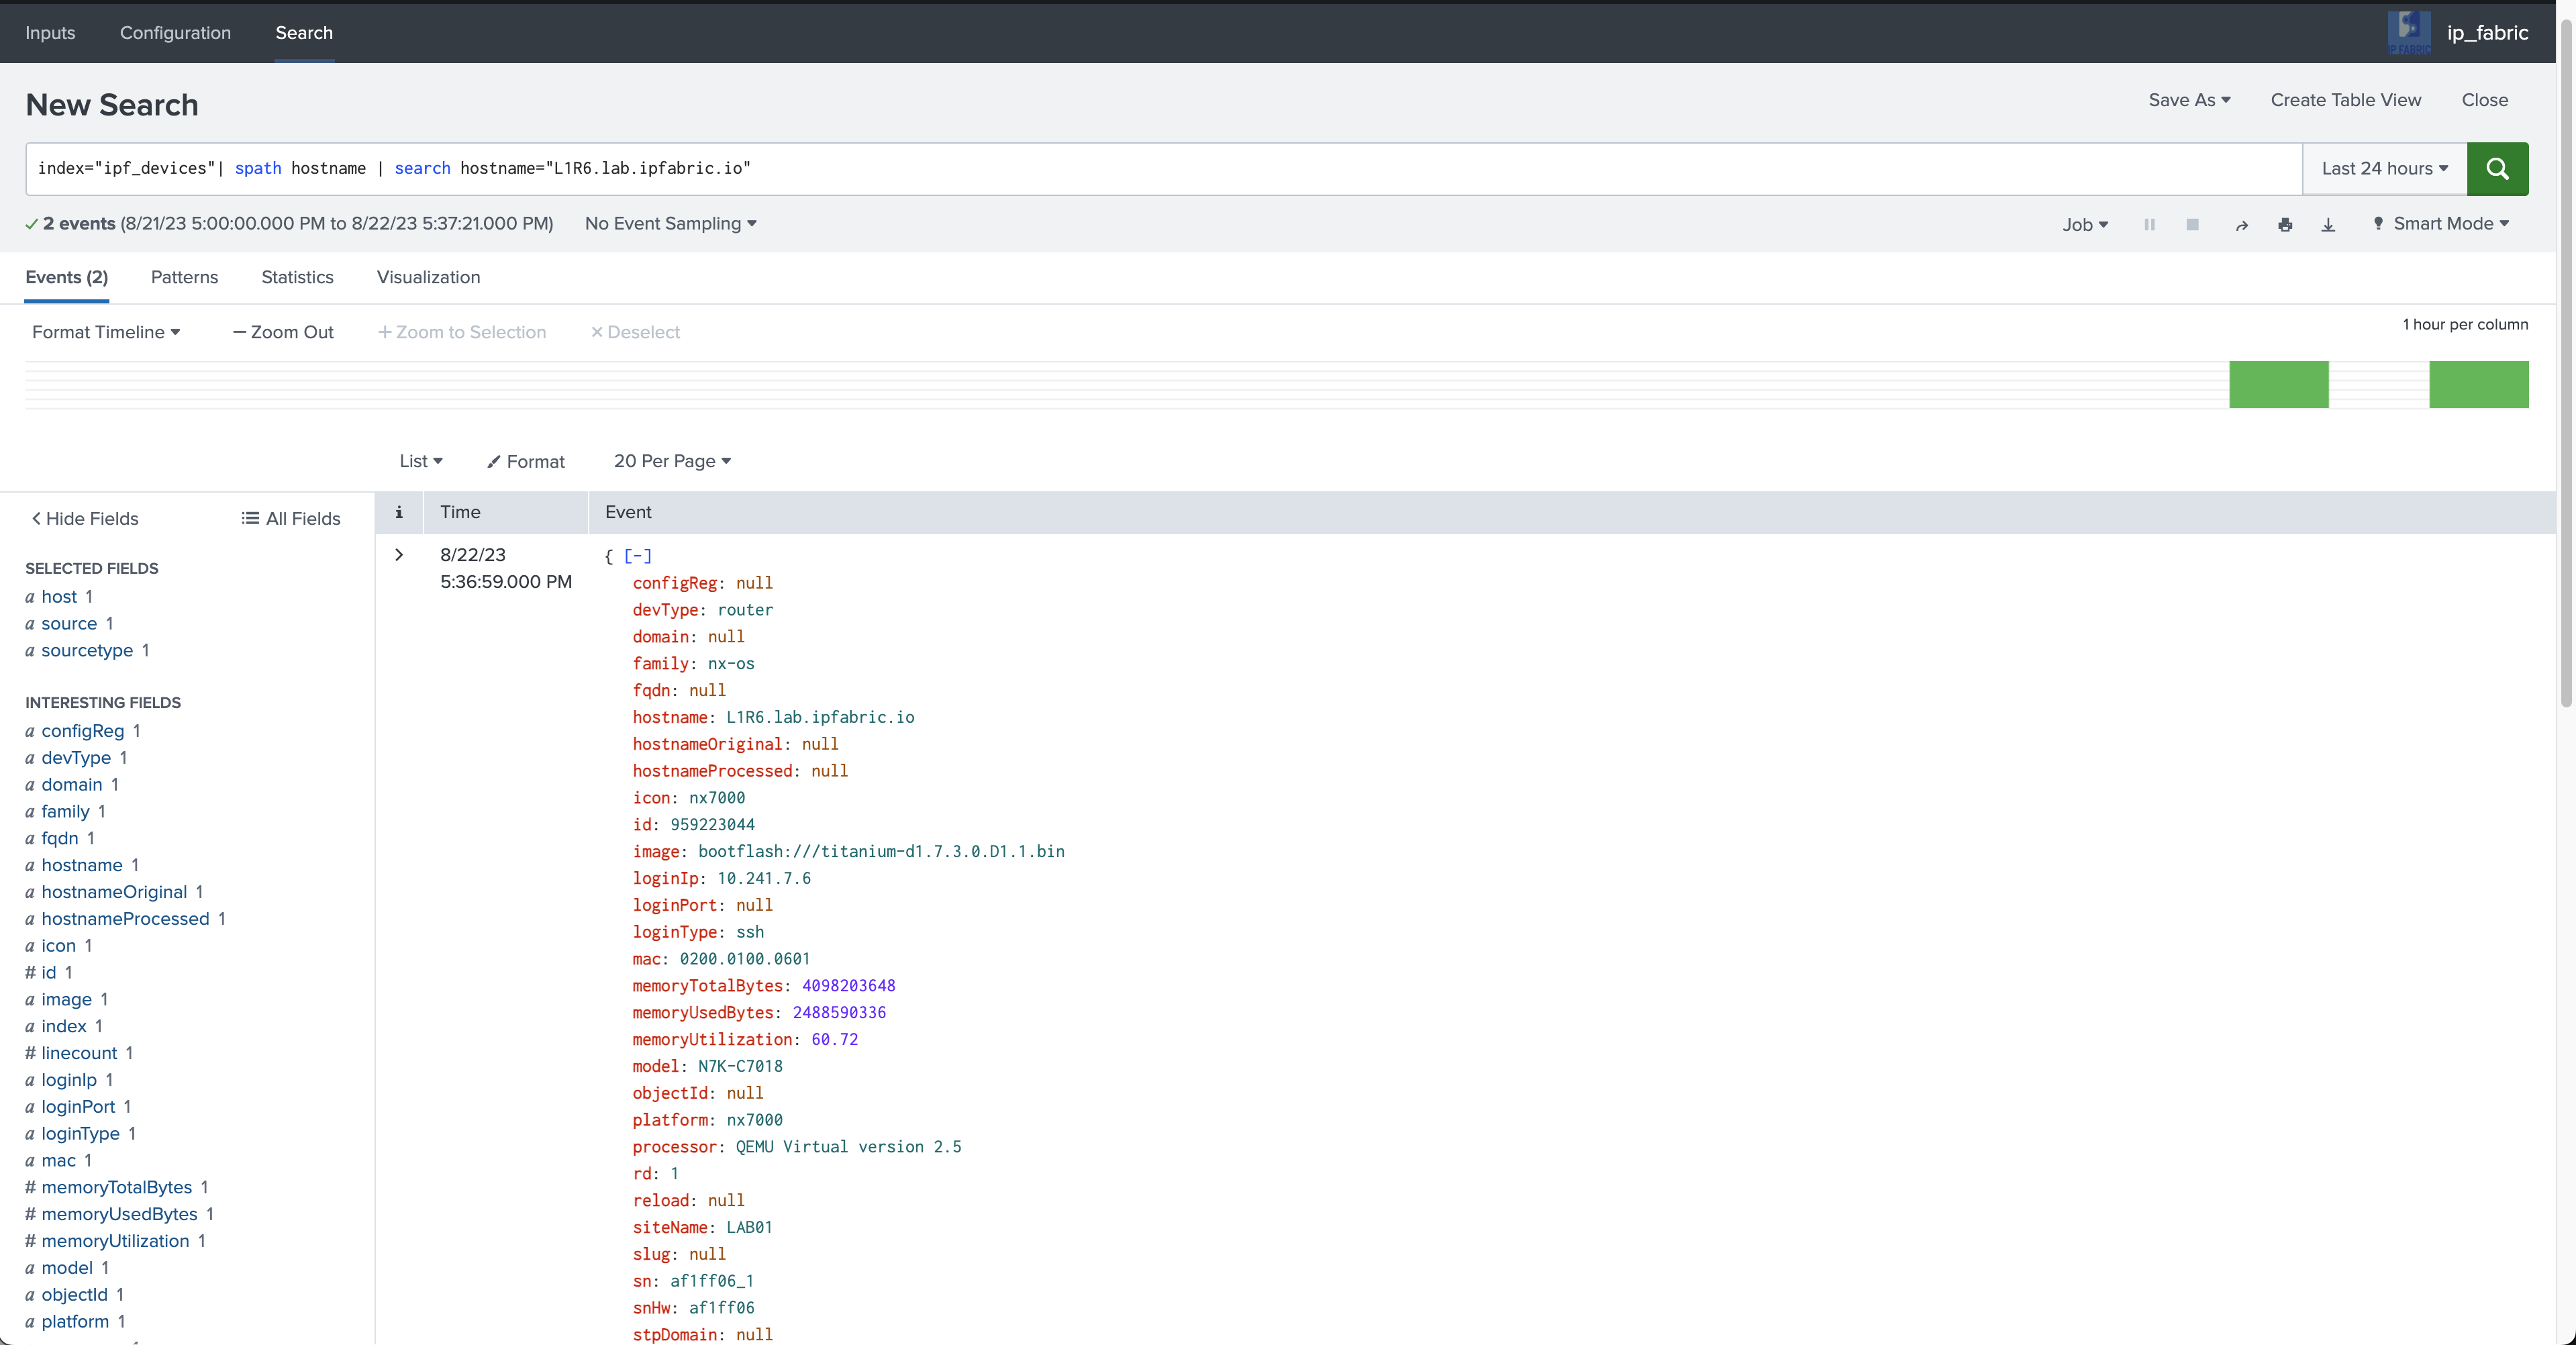
Search an Index Loaded With IP Fabric Data
Using the search bar, you can search for any data that has been loaded into the index. You can start correlating data in other Splunk indexes with IP Fabric data.