IP Fabric MCP Server
Overview
The IP Fabric MCP Server is a Model Context Protocol (MCP) server that provides AI assistants with access to your IP Fabric network data. Key capabilities include:
- Query network health using natural language
- Analyze connectivity paths between endpoints with visual diagrams
- Explore device inventory and configurations
- Troubleshoot routing issues (BGP, OSPF, and more)
- Validate network intents and compliance
The server exposes IP Fabric’s capabilities through standardized MCP tools, prompts, and resources that AI assistants can use to answer your network-related questions.
Prerequisites
- HTTPS access to an instance of IP Fabric
- API Token from your IP Fabric instance with appropriate permissions
- MCP Server Terms & Conditions accepted and the server enabled in the IP Fabric UI (see Step 1 below)
- An AI assistant that supports MCP — tested with Claude Desktop and VS Code with GitHub Copilot
Security Considerations
- API Token: Your IP Fabric API token is used to authenticate AI assistant requests. The MCP server has no implicit access to IP Fabric data — every request is authorized solely through the provided API token. Generate a dedicated token with the minimum required permissions and rotate it regularly.
- Network Access: The MCP server runs on the IP Fabric appliance and is accessed over HTTPS. Ensure appropriate network segmentation and firewall rules are in place between your AI client and the appliance.
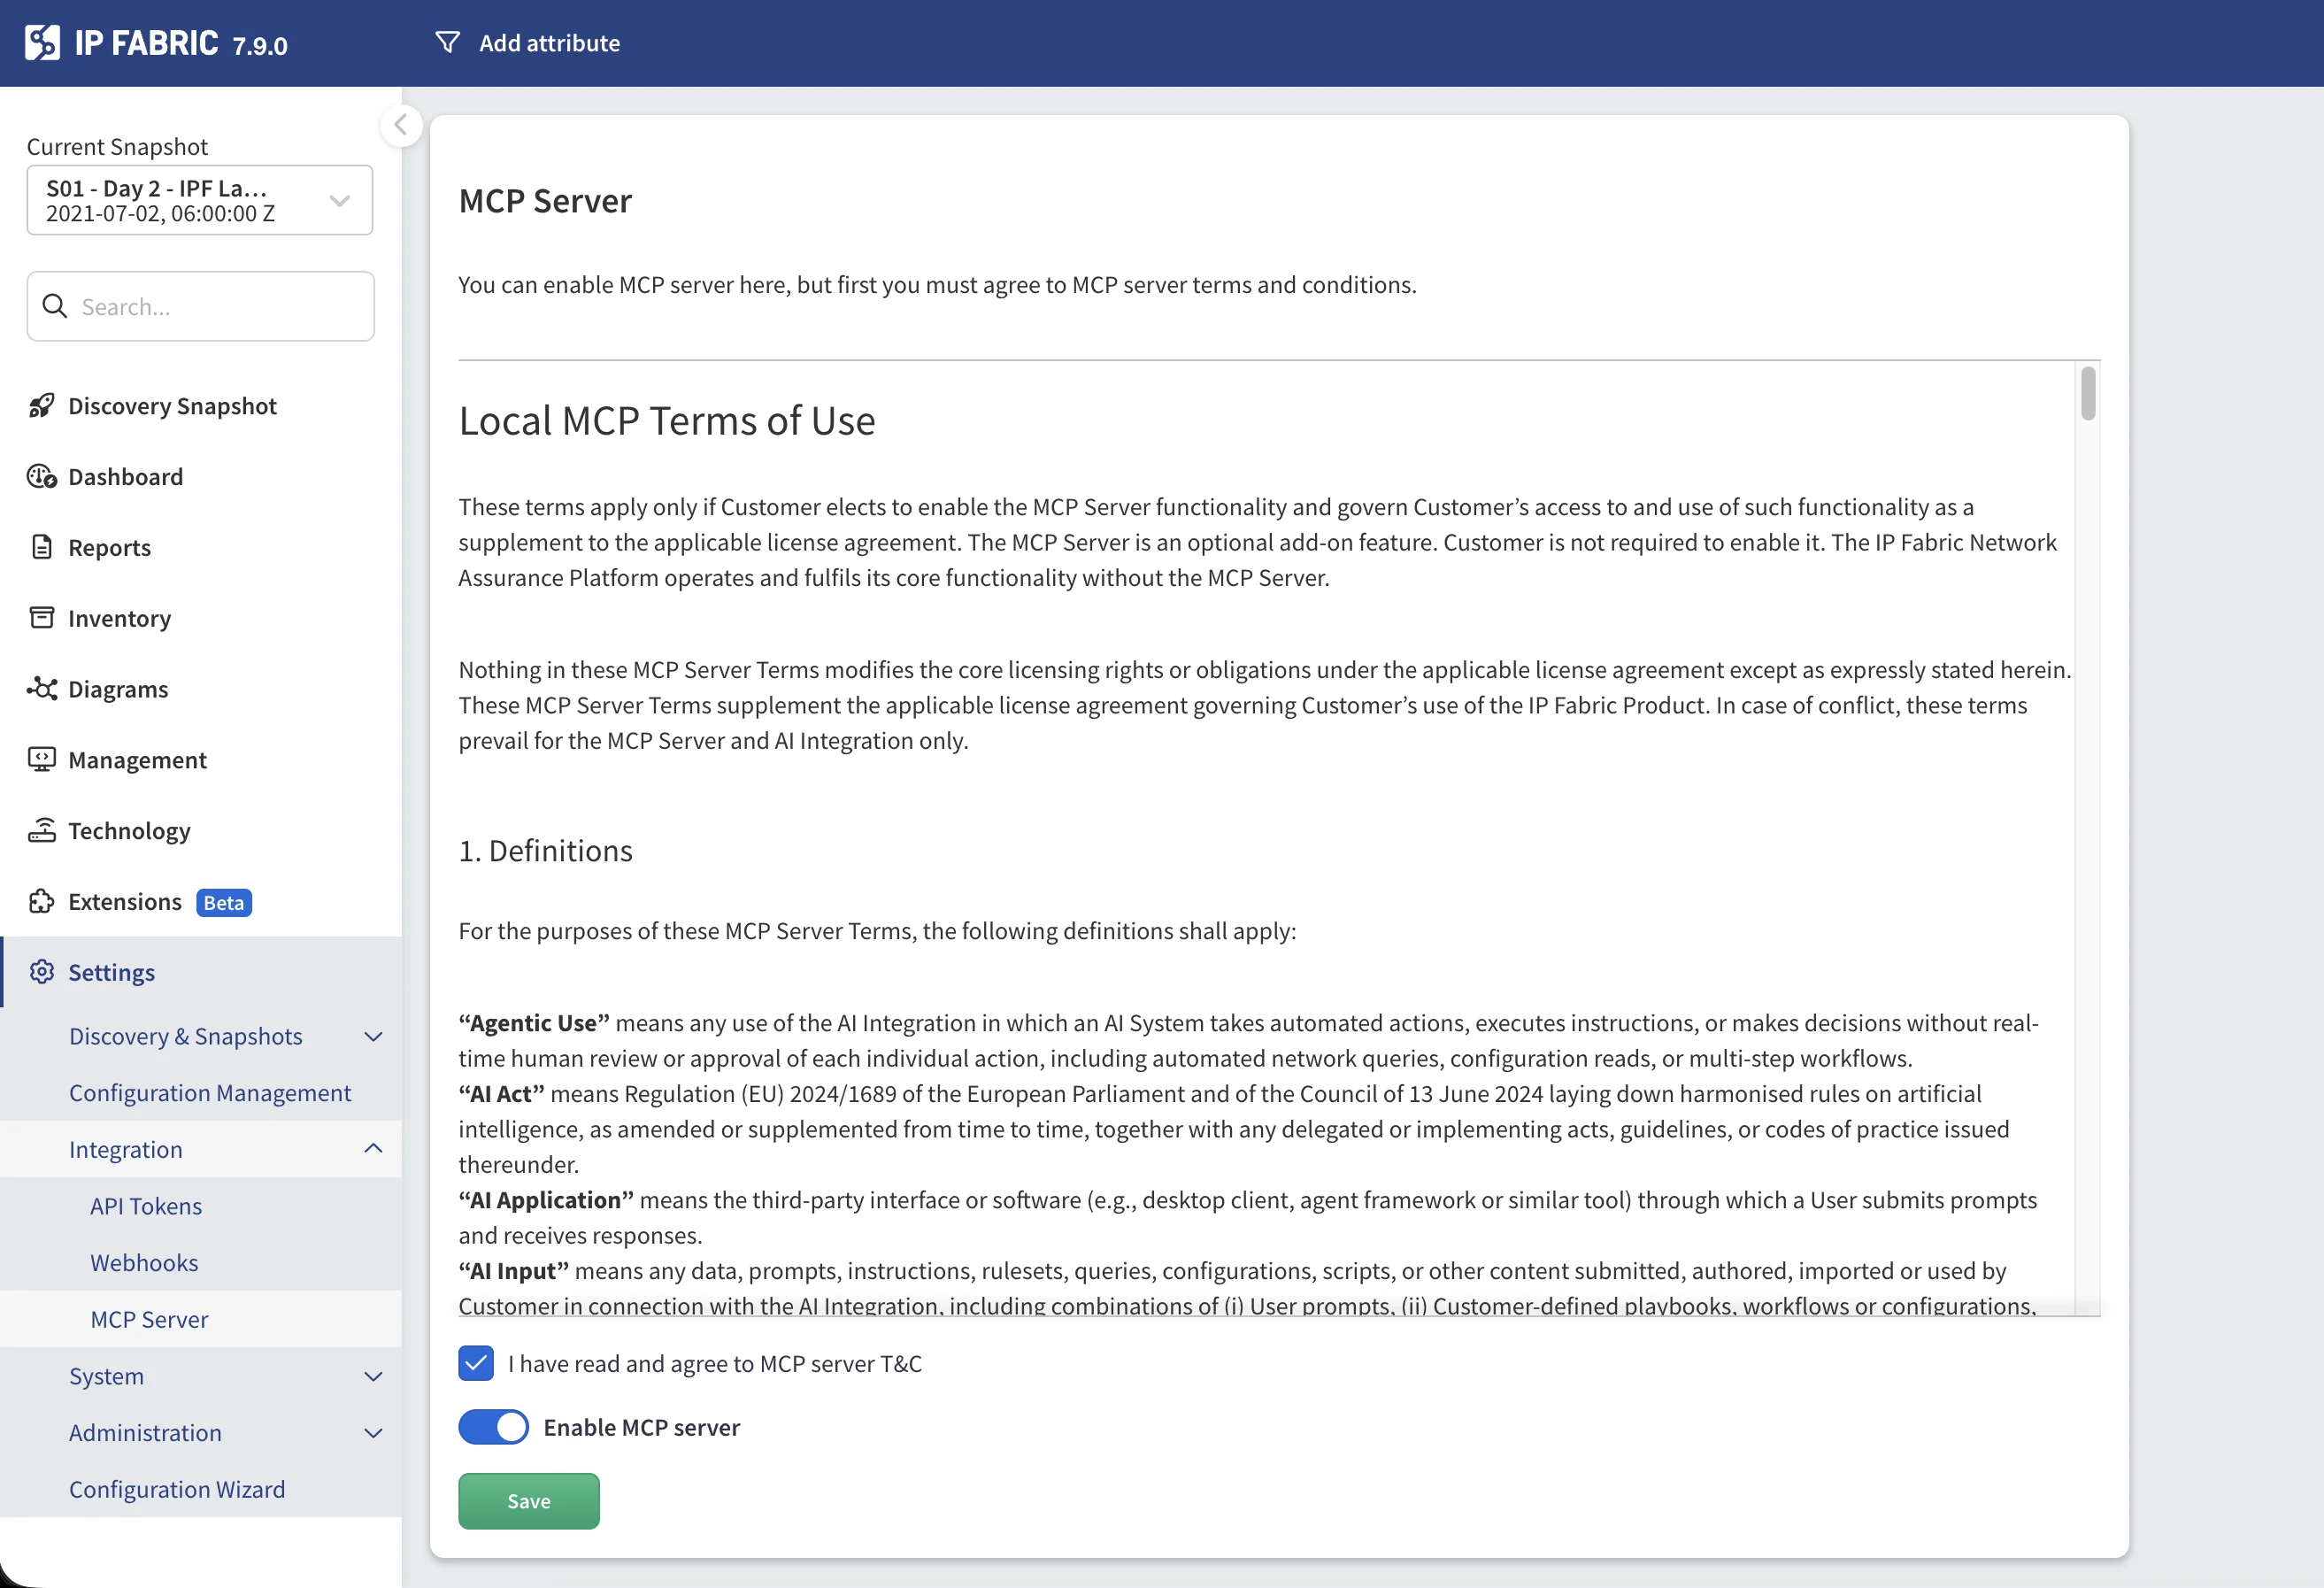
Step 1 — Enable the MCP Server in IP Fabric
The MCP server is built into the IP Fabric appliance and can be enabled directly from the web UI.
- Log in to your IP Fabric instance.
- Navigate to Settings → Integration → MCP Server.
- Read the Local MCP Terms of Use and check I have read and agree to MCP server T&C.
- Toggle Enable MCP server to on.
- Click Save.
Once enabled, the MCP server endpoint is available at
https://<your-ipfabric-host>/mcp.
Step 2 — Generate an API Token
The MCP server authenticates to IP Fabric using an API token. The token’s Role-Based Access Control (RBAC) scope is fully respected — the MCP server (and therefore the AI assistant) can only access the data and actions permitted by the role assigned to the token.
Multiple AI clients can connect to the same MCP server simultaneously, each using its own API token. Every token is evaluated independently, so different users or teams can have separate access levels through the same MCP endpoint.
When creating the token, select a role with the minimum permissions required for your use case. For instructions on creating an API token, see API Tokens. For details on how the token is used for authentication, see Authentication — API Token.
Step 3 — Connect to an AI Assistant
Claude Desktop
At the time of writing, Claude Desktop only supports local (stdio) MCP servers. A local proxy is therefore needed to connect to the remote IP Fabric MCP server. This requires Node.js LTS to be installed on your machine.
1. Locate your Claude Desktop configuration:
Select your user profile, then Settings, then Developer. Clicking Edit
will open claude_desktop_config.json.
2. Add the MCP server configuration:
{
  "mcpServers": {
    "ipfabric-mcp": {
      "command": "npx",
      "args": [
        "-y",
        "mcp-remote",
        "https://<your-ipfabric-host>/mcp",
        "--header",
        "Authorization:${AUTH_HEADER}"
      ],
      "env": {
        "AUTH_HEADER": "Bearer <YOUR_API_TOKEN_HERE>"
      }
    }
  }
}
Note
We use the npx command to download and start a proxy called mcp-remote in Node.
npxlooks up an npm package and runs its executable, downloading it on the fly.-yauto-confirms the install prompt.mcp-remoteis the name of the npm package being executed.--headerpasses theAuthorizationheader on every request to the MCP server.- The token value is kept in
envto avoid exposing it directly in the args. Use the formatBearer <token>.
3. Restart Claude Desktop to apply the configuration.
4. Verify the connection: Look for the MCP tools icon in Claude’s interface.
VS Code with GitHub Copilot
1. Locate your VS Code MCP configuration:
- macOS:
~/Library/Application Support/Code/User/mcp.json - Linux:
~/.config/Code/User/mcp.json - Windows:
%APPDATA%\Code\User\mcp.json
2. Add the server configuration:
{
  "servers": {
    "ipfabric-mcp": {
      "url": "https://<your-ipfabric-host>/mcp",
      "type": "http",
      "headers": {
        "Authorization": "Bearer <YOUR_API_TOKEN_HERE>"
      }
    }
  }
}
3. Start the MCP server from VS Code:
- Open Command Palette:
⌘+Shift+P(macOS) orCtrl+Shift+P(Windows/Linux) - Run:
MCP: List Servers - Select:
ipfabric-mcp→Start Server
4. Verify in the Output panel (View → Output) that tools are loaded successfully.
Note
If you encounter JSON validation errors, disable JSON validation in VS Code settings: search for JSON > Validate: Enable and uncheck it.
Step 4 — Use the MCP Server
Available Tools
The MCP server provides specialized tools for network analysis. Your AI assistant automatically selects the appropriate tool based on your prompt.
Network Health Assessment
Tool: ipf_network_health_assess
Provides a comprehensive overview of your network health including:
- Snapshot freshness — How recent is the network discovery data
- Intent verification — Built-in and custom intent rule results
- Inventory issues — Device health, uptime, licensing
- Routing stability — BGP/OSPF neighbor states
- Path check results — End-to-end connectivity validation
Example prompts:
Check network health
Show me critical issues only
What's the BGP status across my network?
Are there any routing problems?
Path Lookup Tools
Unicast Path Lookup
Tool: ipf_pathlookup_unicast
Traces the path between two IP addresses and returns structured path data.
Example prompts:
Show me the path from 10.0.1.5 to 10.0.2.10
Why can't 192.168.1.100 reach 172.16.0.50?
Parameters:
| Parameter | Required | Description |
|---|---|---|
src |
Yes | Source IP address |
dst |
Yes | Destination IP address |
snapshotId |
Yes | UUID of the snapshot to analyze |
groupBy |
Yes | Grouping method: siteName, routingDomain, or stpDomain |
protocol |
No | Protocol: icmp (default), tcp, or udp |
l4Options |
No | Layer 4 options (ports, flags) |
vrf |
No | VRF name if applicable |
includeGraphLayout |
No | Include graph layout data in the response. By default, layout data is stripped from the result; set to true to include it explicitly. Default: false |
Host-to-Gateway Path Lookup
Tool: ipf_pathlookup_host-to-gateway
Traces the path from a host to its default gateway and returns structured path data.
Example prompts:
Show path from 192.168.1.100 to its gateway
How does host 10.0.5.25 reach its gateway?
Parameters:
| Parameter | Required | Description |
|---|---|---|
src |
Yes | Source IP address |
snapshotId |
Yes | UUID of the snapshot to analyze |
groupBy |
Yes | Grouping method: siteName, routingDomain, or stpDomain |
vrf |
No | VRF name if applicable |
includeGraphLayout |
No | Include graph layout data in the response. By default, layout data is stripped from the result; set to true to include it explicitly. Default: false |
Multicast Path Lookup
Tool: ipf_pathlookup_multicast
Traces multicast traffic paths from source to receivers and returns structured path data.
Example prompts:
Show multicast path for group 239.1.1.1 from source 10.0.1.5
Analyze multicast distribution for 239.255.0.1
Parameters:
| Parameter | Required | Description |
|---|---|---|
src |
Yes | Source IP address |
group |
Yes | Multicast group address |
receiver |
Yes | Comma-separated receiver IP addresses |
snapshotId |
Yes | UUID of the snapshot to analyze |
groupBy |
Yes | Grouping method |
includeGraphLayout |
No | Include graph layout data in the response. By default, layout data is stripped from the result; set to true to include it explicitly. Default: false |
Path Diagram Tools
Each path lookup tool has a companion that returns a PNG diagram of the path instead of structured data.
| Diagram Tool | Corresponding Path Lookup |
|---|---|
ipf_png_pathlookup_unicast |
ipf_pathlookup_unicast |
ipf_png_pathlookup_host-to-gateway |
ipf_pathlookup_host-to-gateway |
ipf_png_pathlookup_multicast |
ipf_pathlookup_multicast |
The diagram tools accept the same parameters as their corresponding path lookup tools (excluding
includeGraphLayout) and return a visual network path image.
Example prompts:
Trace route from server A to server B with diagram
Show multicast path for group 239.1.1.1 from source 10.0.1.5 with diagram
API Discovery Tools
For advanced queries not covered by specialized tools, use the API discovery workflow.
API Endpoint Search
Tool: ipf_api_endpoint_search
Finds relevant API endpoints using natural language.
Example prompts:
Find endpoints for device inventory
Search for BGP neighbor API
API Endpoint Details
Tool: ipf_api_endpoint_details
Gets detailed information about a specific endpoint including parameters and response schema.
API Invoke
Tool: api_invoke
Executes an API call with the specified parameters.
Example workflow:
- Search:
"device inventory endpoints" - Get details for the relevant endpoint
- Invoke the endpoint with appropriate filters
Available Prompts
Prompts provide structured templates for complex analysis tasks.
Path Analysis Prompt
Name: path_analysis
A guided prompt for detailed path analysis between network points.
How to use:
- Claude Desktop — Type
/in the chat and selectpath_analysis. - VS Code with GitHub Copilot — Type
@ipfabric-mcpin the chat to invoke the MCP server, then describe the path analysis you need.
Parameters:
snapshot— Snapshot name to analyzesource— Source IP or device namedestination— Destination IP (for unicast)group— Multicast group (if applicable)protocol— TCP, UDP, or ICMP (optional)
This prompt generates a comprehensive analysis including hop-by-hop breakdown, issue identification, and topology improvement recommendations.
Available Playbooks (Resources)
Playbooks are reference guides provided by the MCP server that help the AI assistant make better decisions. They contain domain-specific knowledge about network troubleshooting workflows and best practices. How playbooks are selected or attached depends on the AI client you are using — in Claude Desktop, they appear as resources in the MCP tools panel; in VS Code, they are available as context for the AI assistant.
Usage Examples
Health Monitoring
Basic health check:
Check network health
Focus on specific areas:
Show me BGP issues only
Check routing protocol status with critical issues only
Investigate specific problems:
Are there any devices with high CPU utilization?
Path Analysis
Basic connectivity:
Show the path from 10.0.1.5 to 10.0.2.10 with diagram
With protocol specification:
Trace the path from 192.168.1.10 to 172.16.0.5 using TCP port 443
Host to gateway:
Show how 192.168.1.100 reaches its default gateway
VRF-aware path:
Show path from 10.1.1.1 to 10.2.2.2 in VRF MGMT
Multicast:
Show multicast path for group 239.1.1.1 from source 10.0.1.5 with diagram
Device Queries
Site-based inventory:
Show all Cisco devices in site HQ
Status queries:
Find devices with uptime less than 1 day
List devices with telnet enabled
Protocol Analysis
BGP:
Show BGP neighbors that are not in Established state
OSPF:
List OSPF neighbors not in Full state
General routing:
Are there any routing adjacency issues?
Troubleshooting
Connection Issues
Cannot reach the MCP server:
- Verify the MCP server is enabled in Settings → Integration → MCP Server.
- Ensure the API token is valid and has not been revoked.
API Errors
401 Unauthorized:
- Verify your API token is correct.
- Check that the token has not been revoked.
- Ensure the token has sufficient permissions.
404 Not Found:
- Verify the MCP server is enabled and that the URL is correct.
Snapshot Errors
“Snapshot not found”:
- Ensure snapshots are loaded in IP Fabric.
- The AI will automatically list available snapshots if needed.
- You can specify
$lastto use the most recent snapshot.
Common Questions
How do I disable the MCP server?
Navigate to Settings → Integration → MCP Server, toggle Enable MCP server to off, and click Save.
Can I use a different API token for MCP?
Yes. Generate a dedicated token under Settings → Integration → API Tokens with the minimum required permissions and configure your AI client to use it.